
 Web Front-end
JS Tutorial
Detailed explanation of breakpoint debugging using Visual Studio Code on Node.js
Web Front-end
JS Tutorial
Detailed explanation of breakpoint debugging using Visual Studio Code on Node.js
Detailed explanation of breakpoint debugging using Visual Studio Code on Node.js
This article mainly introduces the detailed explanation of using Visual Studio Code to debug Node.js breakpoints, which has certain reference value. Interested friends can refer to it
In the development process, It is almost impossible to write a flawless program in one go, and debugging code with breakpoints is a common requirement.
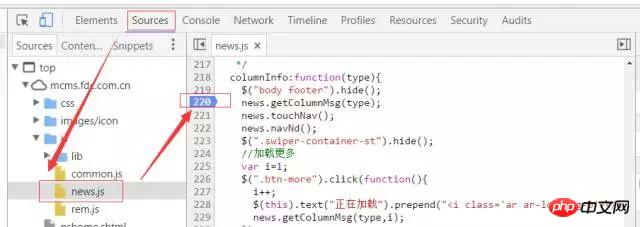
As a front-end development engineer, the JavaScript programs we developed in the past were all run on the browser side. We can use the developer tools provided by Chrome to easily debug source code breakpoints. There are four steps. The details are not shown, but a rough summary is as follows:
Open the Chrome developer tools;
Click to enter the Sources tab, in You can see the directory of JS code on the left side of the page;
Find the source file where you need to set a breakpoint, and click the left mouse button to the left of the line of code that needs to be interrupted. Breakpoints can be set. If your code has been uglified, you need to import the corresponding source-map to map the source code.
Refresh the page (if the location where the breakpoint is set is an event processing function, just trigger the event directly). When the code runs to the breakpoint, the program will hang. , at this time, you can use the mouse hover to view the current values of each variable, and use this to determine whether the program is running normally.
#However, when we use JavaScript to develop Node.js programs that run on the server, the Chrome developer tools are temporarily of no use. Although there are ways to debug on Chrome, this is beyond the scope of our discussion today.
Also, the classmate who said to use console.log, please don’t say anything for now...
In fact, many IDEs have integrated Debug functions, including newer versions. WebStorm supports Node.js debugging very well.
But many developers feel that IDE is too heavy. Are there any lighter tools to implement breakpoint debugging? Today I’m going to show you how to perform breakpoint debugging on VScode.
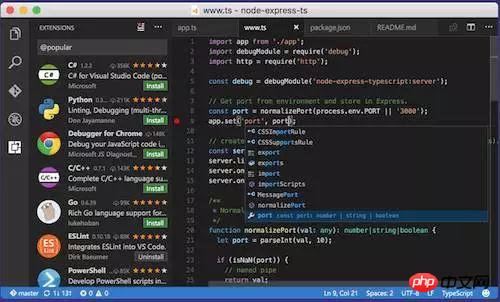
In addition to out-of-box support for JavaScript and TypeScript, VScode also supports Node.js debugging. It is simply born for front-end engineers, right...
The prerequisite for debugging Node.js is that the Node.js environment has been installed on your computer.
What? How to install Node.js? Here’s a little tip: Open Baidu and search for [Install Node.js]. Okay, no more prompts.
This article takes debugging the express application as an example and assumes that you have installed the Node.js running environment.
Create express application
We use express-generator to create a new express application.
1. Install express-generator globally
a. Open the terminal and enter:
npm install express-generator -g
MacBook When the user installs globally, remember to add sudo
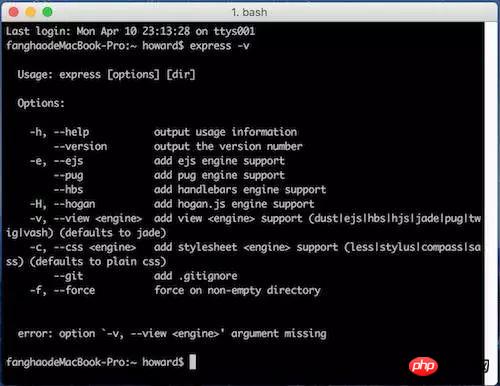
b in front. After the installation is completed, enter
express -v
in the terminal. If you see the following picture: message indicating that the installation has been successful.
2. Generate the express application directory, assuming the name of this application is myapp
Enter
in the terminal
express myapp
A myapp directory is generated in the current directory. The directory structure is as follows:
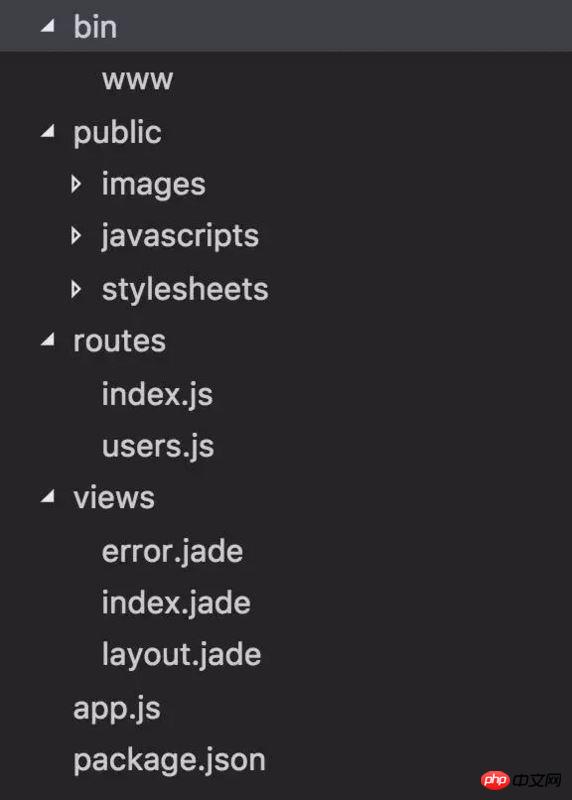
As you can see, this small application is fully functional. There are Node server configuration, public resource folder, master and apprentice folder, and routing configuration.
3. Run the express application
a. Enter the command
cd myapp && npm install
in the terminal to enter the project directory and install all dependencies. This step may take a long time, so be patient and wait for the installation to complete.
b. Then enter the command
npm start
to start the application.
At this time, when we visit localhost:3000 in the browser, we can see the following page:
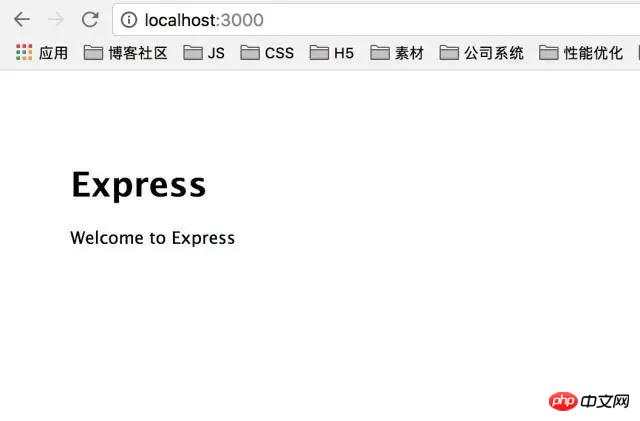
This means that the express application can run normally, and then Next we can use VScode to debug the code.
Tip: In order to avoid port conflicts during debugging, we first return to the terminal where the express application was just running, and ctrl+c closes the running express application.
Debug express application
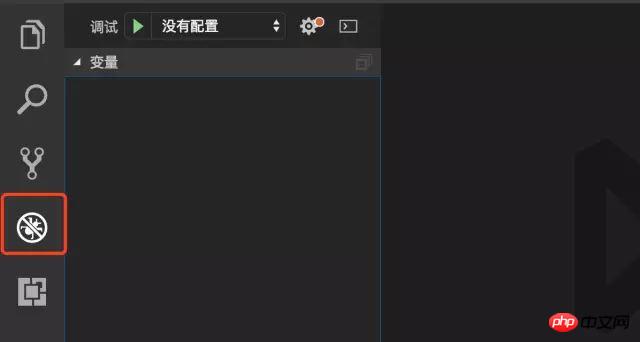
1. Enter the VScode interface, click the fourth bug-like button on the left side of the interface to enter the debugging interface:
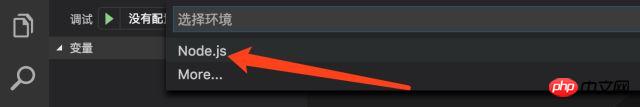
2. Click the "No Configuration" drop-down menu at the top of the page and select "Add Configuration".
3. Select Node.js environment.
4. After the selection is completed, a .vscode directory will be generated in the root directory of the project. This directory stores various VScode editor configurations. . This directory now contains a configuration file named lanuch.json. The content of the configuration file is as follows:
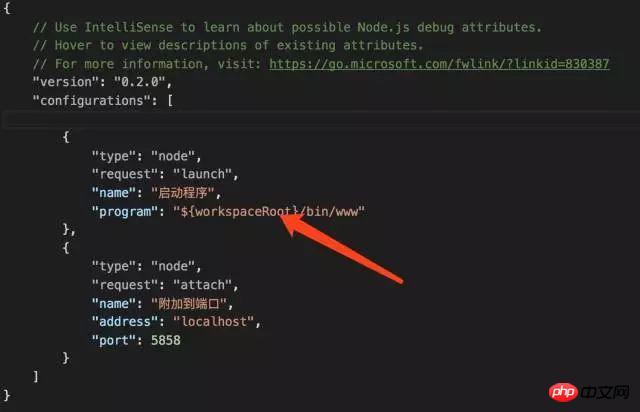
The most important configuration item is the "Program" field , this field defines the entry point of the entire application. When the debugger is turned on, the application will be started from this entry point.
We found that this field already has a value, don’t panic, that’s because when VScode initializes this configuration file, it will check whether package.json contains scripts with the key name start. If so, If so, the content of the start configuration will be used as the value of the "program" field.
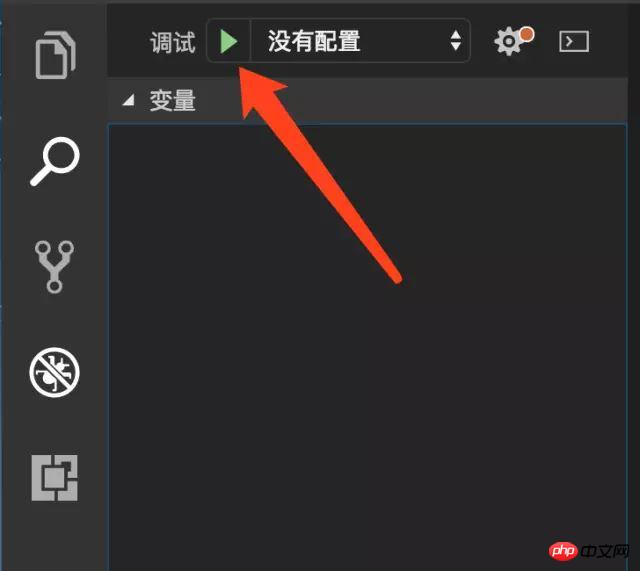
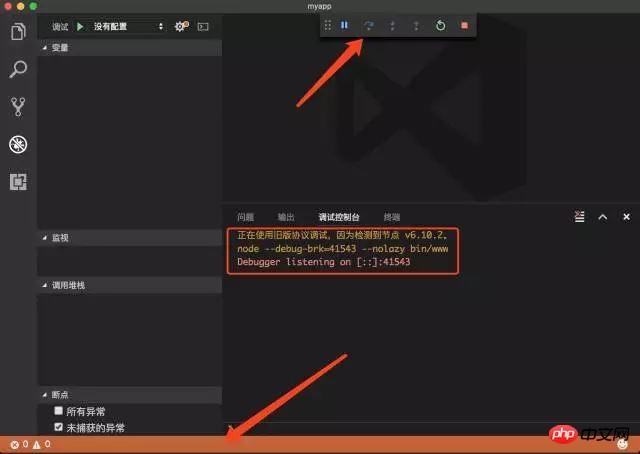
5. Click the Start Debugging button (green triangle) to start debugging. At this time, a debugging control panel will appear at the top of the interface, and a debugging console will appear at the bottom right of the page, where you can view the information you output. A status bar will appear at the bottom of the interface. The current orange color indicates that the application is running normally, as follows As shown in the picture:
#6. When we visit localhost:3000 again while browsing, we will find that the page can be opened and the application has started normally.
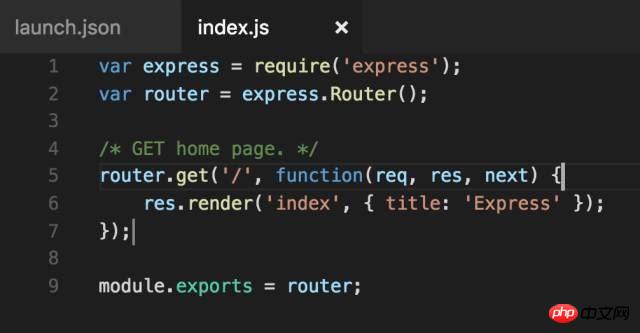
7. Next we start setting breakpoints for the application. We open the myapp/routes/index.js file. This file configures the routing of the application root path. The current processing is to return a page and pass in the string "Express" as a parameter of the view.
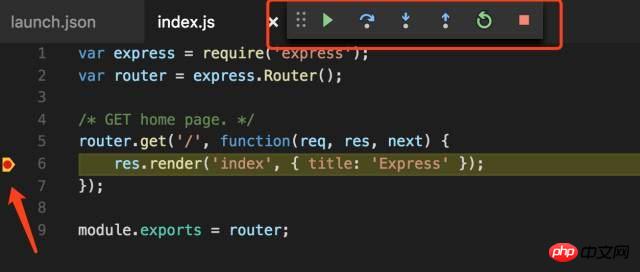
#8. We use the mouse to left-click on the left side of line number 6 to set a breakpoint. Note that you must turn off debugging before adding breakpoints. To turn off, click the Stop button (red square) in the debugging control panel above the interface.
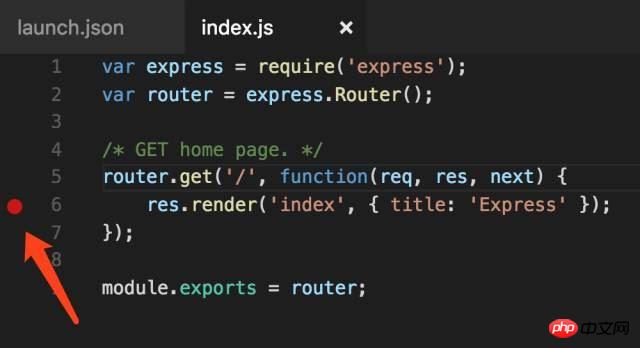
9. After setting the breakpoint, restart debugging, and then access localhost:3000 in the browser. At this time, the shape of the breakpoint changes and the program stays At the breakpoint, the buttons on the debugging control panel have also changed. From left to right, they are single-step skip, single-step debugging, single-step out, restart, and stop debugging. These are common breakpoint debugging instructions. After setting the breakpoint, restart debugging, and then access localhost:3000 in the browser. At this time, the shape of the breakpoint changes, the program stays at the breakpoint, and the buttons on the debugging control panel also change, from left to On the right are single-step skip, single-step debugging, single-step out, restart, and stop debugging. These are common breakpoint debugging instructions.
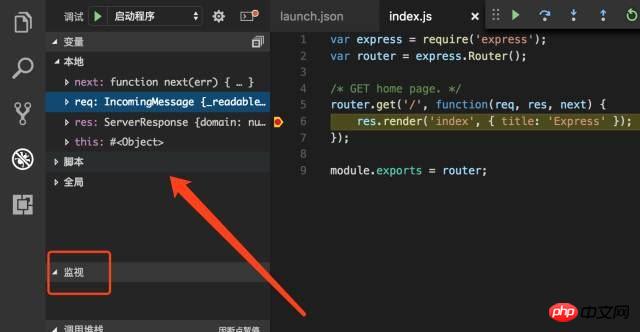
#10. On the left side of the interface, you can view the current context environment and set variable monitoring.
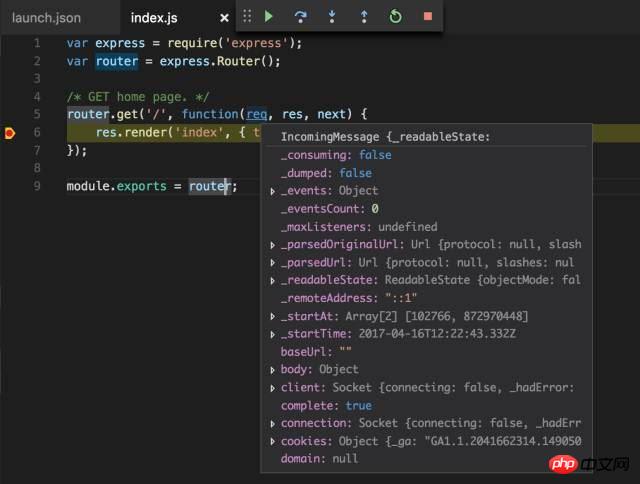
11. Place the mouse on the variable or parameter before the breakpoint, and you can also view the current value of the variable. The experience is consistent with the debugging of Chrome developer tools.
#Well, let’s start the Node.js debugging journey with VScode! !
That console.log classmate, you can speak...
The above is the detailed content of Detailed explanation of breakpoint debugging using Visual Studio Code on Node.js. For more information, please follow other related articles on the PHP Chinese website!

Hot AI Tools

Undresser.AI Undress
AI-powered app for creating realistic nude photos

AI Clothes Remover
Online AI tool for removing clothes from photos.

Undress AI Tool
Undress images for free

Clothoff.io
AI clothes remover

Video Face Swap
Swap faces in any video effortlessly with our completely free AI face swap tool!

Hot Article
Hot Tools

Notepad++7.3.1
Easy-to-use and free code editor

SublimeText3 Chinese version
Chinese version, very easy to use

Zend Studio 13.0.1
Powerful PHP integrated development environment

Dreamweaver CS6
Visual web development tools

SublimeText3 Mac version
God-level code editing software (SublimeText3)
Hot Topics
 1664
1664
 14
1423
52
1317
25
1268
29
1246
24
14
1423
52
1317
25
1268
29
1246
24

 How to implement an online speech recognition system using WebSocket and JavaScript
Dec 17, 2023 pm 02:54 PM
How to implement an online speech recognition system using WebSocket and JavaScript
Dec 17, 2023 pm 02:54 PM
How to use WebSocket and JavaScript to implement an online speech recognition system Introduction: With the continuous development of technology, speech recognition technology has become an important part of the field of artificial intelligence. The online speech recognition system based on WebSocket and JavaScript has the characteristics of low latency, real-time and cross-platform, and has become a widely used solution. This article will introduce how to use WebSocket and JavaScript to implement an online speech recognition system.
 WebSocket and JavaScript: key technologies for implementing real-time monitoring systems
Dec 17, 2023 pm 05:30 PM
WebSocket and JavaScript: key technologies for implementing real-time monitoring systems
Dec 17, 2023 pm 05:30 PM
WebSocket and JavaScript: Key technologies for realizing real-time monitoring systems Introduction: With the rapid development of Internet technology, real-time monitoring systems have been widely used in various fields. One of the key technologies to achieve real-time monitoring is the combination of WebSocket and JavaScript. This article will introduce the application of WebSocket and JavaScript in real-time monitoring systems, give code examples, and explain their implementation principles in detail. 1. WebSocket technology
 How to use JavaScript and WebSocket to implement a real-time online ordering system
Dec 17, 2023 pm 12:09 PM
How to use JavaScript and WebSocket to implement a real-time online ordering system
Dec 17, 2023 pm 12:09 PM
Introduction to how to use JavaScript and WebSocket to implement a real-time online ordering system: With the popularity of the Internet and the advancement of technology, more and more restaurants have begun to provide online ordering services. In order to implement a real-time online ordering system, we can use JavaScript and WebSocket technology. WebSocket is a full-duplex communication protocol based on the TCP protocol, which can realize real-time two-way communication between the client and the server. In the real-time online ordering system, when the user selects dishes and places an order
 How to implement an online reservation system using WebSocket and JavaScript
Dec 17, 2023 am 09:39 AM
How to implement an online reservation system using WebSocket and JavaScript
Dec 17, 2023 am 09:39 AM
How to use WebSocket and JavaScript to implement an online reservation system. In today's digital era, more and more businesses and services need to provide online reservation functions. It is crucial to implement an efficient and real-time online reservation system. This article will introduce how to use WebSocket and JavaScript to implement an online reservation system, and provide specific code examples. 1. What is WebSocket? WebSocket is a full-duplex method on a single TCP connection.
 JavaScript and WebSocket: Building an efficient real-time weather forecasting system
Dec 17, 2023 pm 05:13 PM
JavaScript and WebSocket: Building an efficient real-time weather forecasting system
Dec 17, 2023 pm 05:13 PM
JavaScript and WebSocket: Building an efficient real-time weather forecast system Introduction: Today, the accuracy of weather forecasts is of great significance to daily life and decision-making. As technology develops, we can provide more accurate and reliable weather forecasts by obtaining weather data in real time. In this article, we will learn how to use JavaScript and WebSocket technology to build an efficient real-time weather forecast system. This article will demonstrate the implementation process through specific code examples. We
 Simple JavaScript Tutorial: How to Get HTTP Status Code
Jan 05, 2024 pm 06:08 PM
Simple JavaScript Tutorial: How to Get HTTP Status Code
Jan 05, 2024 pm 06:08 PM
JavaScript tutorial: How to get HTTP status code, specific code examples are required. Preface: In web development, data interaction with the server is often involved. When communicating with the server, we often need to obtain the returned HTTP status code to determine whether the operation is successful, and perform corresponding processing based on different status codes. This article will teach you how to use JavaScript to obtain HTTP status codes and provide some practical code examples. Using XMLHttpRequest
 How to use insertBefore in javascript
Nov 24, 2023 am 11:56 AM
How to use insertBefore in javascript
Nov 24, 2023 am 11:56 AM
Usage: In JavaScript, the insertBefore() method is used to insert a new node in the DOM tree. This method requires two parameters: the new node to be inserted and the reference node (that is, the node where the new node will be inserted).
 JavaScript and WebSocket: Building an efficient real-time image processing system
Dec 17, 2023 am 08:41 AM
JavaScript and WebSocket: Building an efficient real-time image processing system
Dec 17, 2023 am 08:41 AM
JavaScript is a programming language widely used in web development, while WebSocket is a network protocol used for real-time communication. Combining the powerful functions of the two, we can create an efficient real-time image processing system. This article will introduce how to implement this system using JavaScript and WebSocket, and provide specific code examples. First, we need to clarify the requirements and goals of the real-time image processing system. Suppose we have a camera device that can collect real-time image data
