

JS debugging in JavaScript programming_javascript skills

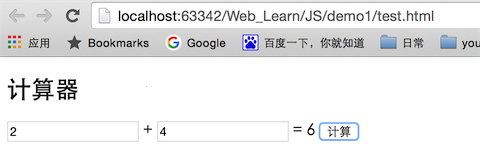
This article mainly introduces how to debug JS through an adder. First enter the code:
Effect:
test.html:
<span style="font-family:Comic Sans MS;font-size:18px;"><!DOCTYPE html>
<html lang="en">
<head>
  <meta charset="UTF-8">
  <title>计算器</title>
</head>
<body>

<div>
  <h2>计算器</h2>

  <div>
    <input type="text" id="num1">
    <span>+</span>
    <input type="text" id="num2">
    <span>=</span>
    <span id="result"></span>
    <button id="add">计算</button>
  </div>
</div>
<script src="./demo.js"></script>
</body>
</html></span> demo.js
<span style="font-family:Comic Sans MS;font-size:18px;">/**
 * Created by yanzi on 15/12/8.
 */
var num1 = document.getElementById("num1"),
  num2 = document.getElementById("num2"),
  result = document.getElementById("result"),
  btn_add = document.getElementById("add");

btn_add.addEventListener("click", onAddClick, false);
function onAddClick(){
  var a = parseInt(num1.value),
  b = parseInt(num2.value);
  var sum = add(a, b);
  result.innerHTML = sum;
}

/**
 *
 * @param a
 * @param b
 * @returns {*}
 */
function add(a, b){
  return a+b;
}</span>
Key summary:
1. Generally when debugging JS, there are three types of printing information:
a. Use alert, the disadvantage is that the box pops up every time
b. Use console.log, the amount of data is small and it’s okay
c. Add breakpoints for debugging
2. In JS, if var is added in front of a variable, it means a local variable. If there is no var in the function, it means a global variable. Therefore, variables are usually preceded by var.
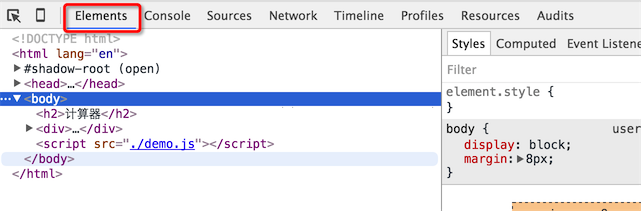
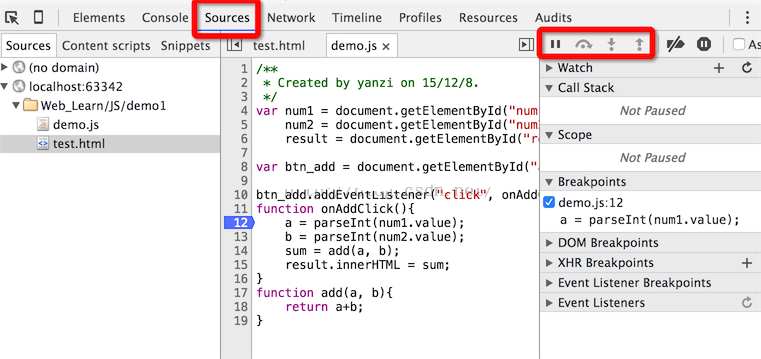
3. Generally in the chrome debugger, look at the code in elements and debug in the source directory. In this mode, you can add breakpoints by clicking on each line in js.
4. The four rightmost buttons in debugging mode are: next breakpoint, single-step execution, enter the next function, and jump out of the function. Basically all debugging tools have these four types.
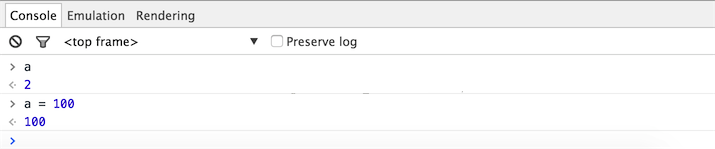
5. In breakpoint mode, you can see the current value by entering a variable in the console, and you can modify the value at will.
The above are the specific steps for js debugging. I hope you will use js for debugging when designing javascript programs. Thank you for reading.

Hot AI Tools

Undresser.AI Undress
AI-powered app for creating realistic nude photos

AI Clothes Remover
Online AI tool for removing clothes from photos.

Undress AI Tool
Undress images for free

Clothoff.io
AI clothes remover

Video Face Swap
Swap faces in any video effortlessly with our completely free AI face swap tool!

Hot Article
Hot Tools

Notepad++7.3.1
Easy-to-use and free code editor

SublimeText3 Chinese version
Chinese version, very easy to use

Zend Studio 13.0.1
Powerful PHP integrated development environment

Dreamweaver CS6
Visual web development tools

SublimeText3 Mac version
God-level code editing software (SublimeText3)
Hot Topics


 Detailed explanation of C++ function debugging: How to debug problems in multi-threaded functions?
May 02, 2024 pm 04:15 PM
Detailed explanation of C++ function debugging: How to debug problems in multi-threaded functions?
May 02, 2024 pm 04:15 PM
C++ multi-thread debugging can use GDB: 1. Enable debugging information compilation; 2. Set breakpoints; 3. Use infothreads to view threads; 4. Use thread to switch threads; 5. Use next, stepi, and locals to debug. Actual case debugging deadlock: 1. Use threadapplyallbt to print the stack; 2. Check the thread status; 3. Single-step the main thread; 4. Use condition variables to coordinate access to solve the deadlock.
 How to use LeakSanitizer to debug C++ memory leaks?
Jun 02, 2024 pm 09:46 PM
How to use LeakSanitizer to debug C++ memory leaks?
Jun 02, 2024 pm 09:46 PM
How to use LeakSanitizer to debug C++ memory leaks? Install LeakSanitizer. Enable LeakSanitizer via compile flag. Run the application and analyze the LeakSanitizer report. Identify memory allocation types and allocation locations. Fix memory leaks and ensure all dynamically allocated memory is released.
 How to do efficient debugging in Java lambda expressions?
Apr 24, 2024 pm 12:03 PM
How to do efficient debugging in Java lambda expressions?
Apr 24, 2024 pm 12:03 PM
Efficiently debug Lambda expressions: IntelliJ IDEA Debugger: Set breakpoints on variable declarations or methods, inspect internal variables and state, and see the actual implementation class. Java9+JVMTI: Connect to the runtime JVM to obtain identifiers, inspect bytecode, set breakpoints, and monitor variables and status during execution.
 Shortcut to golang function debugging and analysis
May 06, 2024 pm 10:42 PM
Shortcut to golang function debugging and analysis
May 06, 2024 pm 10:42 PM
This article introduces shortcuts for Go function debugging and analysis, including: built-in debugger dlv, which is used to pause execution, check variables, and set breakpoints. Logging, use the log package to record messages and view them during debugging. The performance analysis tool pprof generates call graphs and analyzes performance, and uses gotoolpprof to analyze data. Practical case: Analyze memory leaks through pprof and generate a call graph to display the functions that cause leaks.
 How to conduct concurrency testing and debugging in Java concurrent programming?
May 09, 2024 am 09:33 AM
How to conduct concurrency testing and debugging in Java concurrent programming?
May 09, 2024 am 09:33 AM
Concurrency testing and debugging Concurrency testing and debugging in Java concurrent programming are crucial and the following techniques are available: Concurrency testing: Unit testing: Isolate and test a single concurrent task. Integration testing: testing the interaction between multiple concurrent tasks. Load testing: Evaluate an application's performance and scalability under heavy load. Concurrency Debugging: Breakpoints: Pause thread execution and inspect variables or execute code. Logging: Record thread events and status. Stack trace: Identify the source of the exception. Visualization tools: Monitor thread activity and resource usage.
 How to debug PHP asynchronous code
May 31, 2024 am 09:08 AM
How to debug PHP asynchronous code
May 31, 2024 am 09:08 AM
Tools for debugging PHP asynchronous code include: Psalm: a static analysis tool that can find potential errors. ParallelLint: A tool that inspects asynchronous code and provides recommendations. Xdebug: An extension for debugging PHP applications by enabling a session and stepping through the code. Other tips include using logging, assertions, running code locally, and writing unit tests.
 What are the debugging techniques for recursive calls in Java functions?
May 05, 2024 am 10:48 AM
What are the debugging techniques for recursive calls in Java functions?
May 05, 2024 am 10:48 AM
The following techniques are available for debugging recursive functions: Check the stack traceSet debug pointsCheck if the base case is implemented correctlyCount the number of recursive callsVisualize the recursive stack
 PHP Debugging Errors: A Guide to Common Mistakes
Jun 05, 2024 pm 03:18 PM
PHP Debugging Errors: A Guide to Common Mistakes
Jun 05, 2024 pm 03:18 PM
Common PHP debugging errors include: Syntax errors: Check the code syntax to make sure there are no errors. Undefined variable: Before using a variable, make sure it is initialized and assigned a value. Missing semicolons: Add semicolons to all code blocks. Function is undefined: Check that the function name is spelled correctly and make sure the correct file or PHP extension is loaded.
