
 Web Front-end
H5 Tutorial
SVG (Scalable Vector Graphics) basic graphics drawing methods and path commands
Web Front-end
H5 Tutorial
SVG (Scalable Vector Graphics) basic graphics drawing methods and path commands
SVG (Scalable Vector Graphics) basic graphics drawing methods and path commands

SVG (Scalable Vector Graphics) Scalable Vector Graphics
A graphics format used to describe two-dimensional vector graphics
SVG appeared a long time ago
Compared with canvas, it is more suitable for making some small icons, icons, etc.
HTML5 supports inline SVG
Its advantages are as follows:
Scalable
Can be created and modified via a text editor
Can be searched, indexed, scripted, or compressed
Can Print with high quality at any resolution
can be enlarged without losing image quality
canvas is js dynamic Drawing, and svg is an XML document to describe drawing
svg-icon URL: Portal
Let’s take a look at how to use svg drawing
Create svg
Similar to canvas, First, you need to create a tag in the html document
1 |
|
You can also specify the width and height attributes
(if canvas and svg do not specify width and height, the default is 300×150)
But there is another way For the form used (viewbox attribute), you can read my other article: Portal
The next graphic drawing is very similar to canvas, so I will explain more
The difference is that it is written in the form of XML tags Inside the svg tag
And specifying the width and height for the css style of svg will not make it scale proportionally
Basic graphics drawing
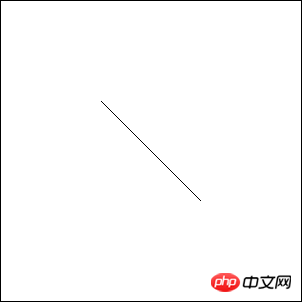
Straight line
1 2 |
|
x1,y1 start Coordinates
x2,y2 End point coordinates
You also need to specify the css style to draw it
1 |
|
(Style attributes refer to the attributes in the canvas environment object)
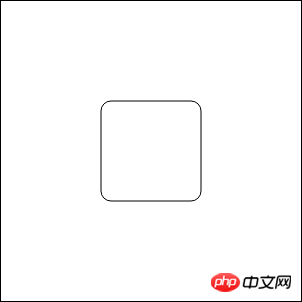
Rectangle
1 2 |
|
x,y rectangle starting coordinates
width,height rectangle width and height
rx,ry rectangle rounded corners
1 |
|
Be careful here The rectangle has a default stylefill: #000;
The following are the same
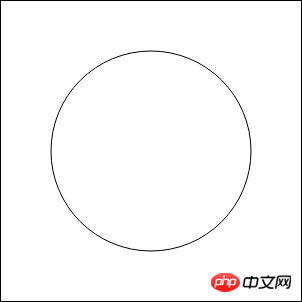
Circle
1 2 |
|
r Radius
cx,cy circle center coordinates
1 |
|
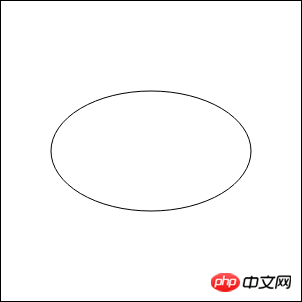
ellipse
1 2 |
|
rx,ry long radius/short radius
cx,cy circle center coordinates
1 |
|
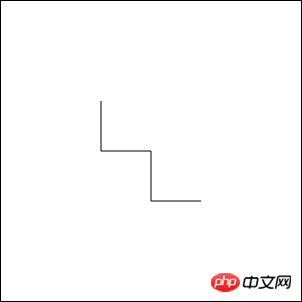
Polyline
1 2 |
|
points specifies the points that the polyline passes through
The horizontal and vertical coordinates are separated by spaces
Multiple coordinates are separated by commas
1 |
|
1
2
<svg width=300 height=300>
<polygon points="100 100, 100 150, 150 150, 150 200, 200 200"></polygon></svg>
Copy after loginCopy after login
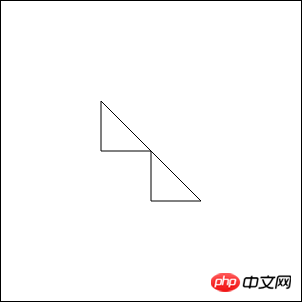
is similar to the polyline above1 2 |
|
except that its end point will connect to the starting point
forming a closed effect
Similar to canvas closePath()
1 |
|
 ##Text
1 2 |
|
x,y text starting coordinate (lower left)
1 |
|
 Path command
The path needs to use the path tag
It has an attribute d, we can add instructions to complete the drawingThis is much simpler than our above drawing method
M/m command and L/l command
1 2 |
|
1 2 |
|
In these two commands, the path generated is the same
The M command is equivalent to the moveTo() in canvas to specify the starting point coordinatesThe L command is equivalent to lineTo() in canvas to specify the middle/end coordinates
The difference is that the M/L command is an absolute coordinate (positioned relative to the svg coordinate origin)
The m/l command is a relative coordinate ( Positioned relative to the previous point)
Of course, you also need to add css style before you can draw
1 |
|
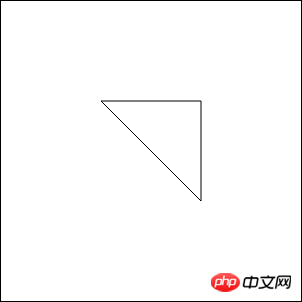
##H/h command and V/v command
Similarly, H and V are absolute instructions, h and v are relative instructions.
1 2 |
|
is equivalent to
1 2 |
|
1 |
|
Specified the path origin 100,100 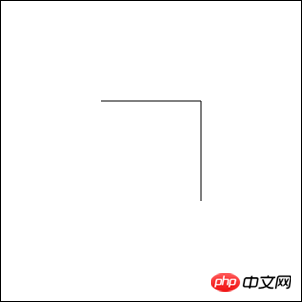 Then moved 100px horizontally to the right, and moved 100px vertically downward
Z /z command
After the line segment is drawn, add the z command
will connect the starting point and end point and close the curveSimilar to closePath()# in canvas ##
1 2 |
|
1 |
|
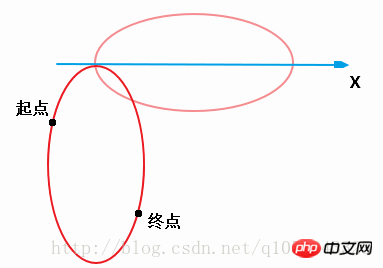
A/a command
 The A/a command is used to draw arcs. It has 7 parameters.
First look at these 7 parameters
rx, ry, x-axis-rotation, large-arc-flag, sweep-flag, x, yrx,ry 表示绘制圆弧的x轴半径和y轴半径
x-axis-rotation 表示圆弧相对x轴的旋转角度,默认顺时针,可以是负值
large-arc-flag 表示圆弧路径是大圆弧还是小圆弧(1大圆弧、0小圆弧)
sweep-flag 表示起点到终点是顺时针还是逆时针(1顺时针、0逆时针)
x,y 终点坐标(A命令绝对坐标、a命令相对坐标)
只是看这些可能不好理解我来举个例子给大家解释一下
其实只要把这个圆弧看成是椭圆的一部分就好理解了
1 2 |
|
1 |
|
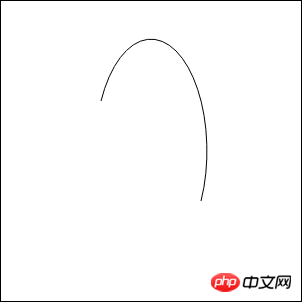
这个例子中弧的起点是100,100
终点是200,200这个不难理解
A指令中前两个参数 100 50
就相当于我先画了一个100×50的椭圆
第三个参数90
便是将这个椭圆顺时针旋转90°
根据起点与终点
此时椭圆可以拆分为一个短路径和一个长路径
第四个参数1
便是表示选取较长的路径作为弧
第五个参数1
表示路径的方向为顺时针
贝塞尔曲线指令Q/T、C/S
二次贝塞尔曲线指令
Q x1 y1 , x y
T x y
三次贝塞尔曲线指令
C x1 y1 , x2 y2 , x y
S x2 y2 , x y
Q命令绘制到(x,y)的二次贝塞尔曲线,(x1,y1)为控制点
T命令绘制到(x,y)的二次贝塞尔曲线,控制点是前一个Q命令控制点的中心对称点
如果没有前一条曲线,当前点会被用作控制点。绘制出来的曲线更流畅
C命令绘制到(x,y)的三次贝塞尔曲线,(x1,y1)(x2,y2)为控制点
S命令绘制到(x,y)的三次贝塞尔曲线,(x2,y2)为新端点的控制点
第一个控制点是前一个C命令控制点的中心对称点
如果没有前一条曲线,当前点会被用作控制点。绘制出来的曲线更流畅
1 2 |
|
1 |
|
关于贝塞尔曲线的数学解释我在canvas写过了
这里就不再说了 → 传送门
SVG样式属性
关于svg的css样式属性
类比于canvas中环境对象的属性
它们含义都是类似的,不多做解释了
fill
stroke
stroke-width
stroke/fill-opacity
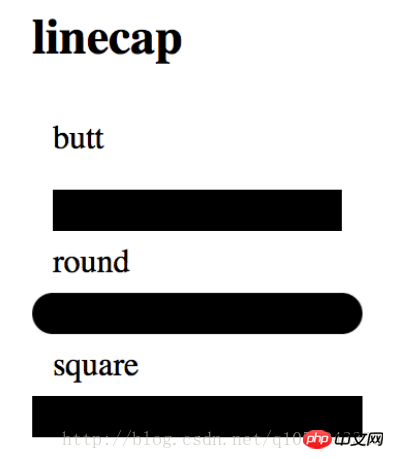
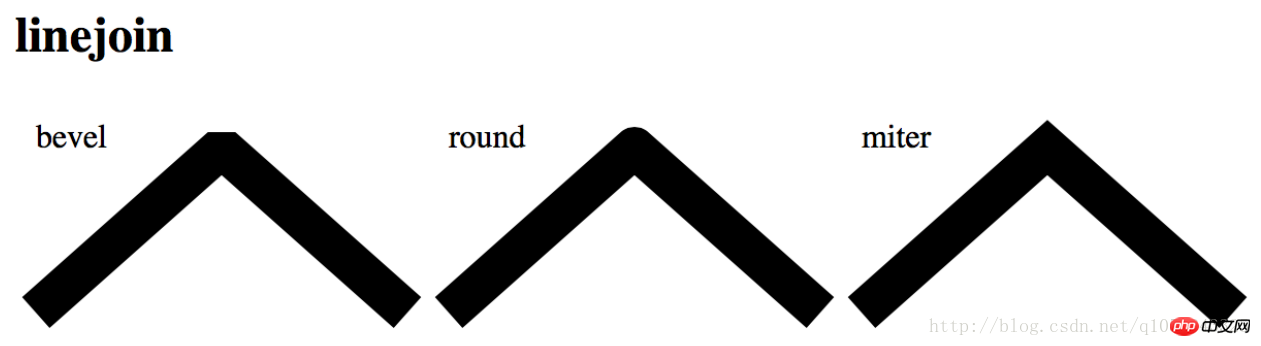
stroke-linecap
stroke-linejoin
==主页传送门==
SVG(Scalable Vector Graphics)可缩放矢量图形
用于描述二维矢量图形的一种图形格式
很早之前SVG就出现了
相比于canvas,它更适合作一些小图标icon等等
HTML5支持内联SVG
它的优点如下:
可伸缩
可通过文本编辑器创建和修改
可被搜索、索引、脚本化或压缩
可在任何的分辨率下被高质量地打印
可在图像质量不下降的情况下被放大
canvas是js动态绘图,而svg是XML文档来描述绘图
svg-icon网址:传送门
下面我们来看一下如何使用svg绘图
创建svg
和canvas类似,首先需要在html文档中创建标签
1 |
|
也可以指定width与height属性
(canvas与svg如果不指定宽高,默认300×150)
不过它还有另外一种使用的形式(viewbox属性),可以看看我的另一篇文章:传送门
接下来的图形绘制和canvas很像了,就多解释了
区别是以XML标签的形式写在svg标签内部
而且为svg的css样式指定宽高不会使它等比缩放
基本图形绘制
直线
1 2 |
|
x1,y1 起始坐标
x2,y2 终点坐标
还需要指定css样式才能够画出来
1 |
|
(样式属性参考canvas环境对象中的属性)
矩形
1 2 |
|
x,y 矩形起始坐标
width,height 矩形宽高
rx,ry 矩形圆角
1 |
|
这里要注意矩形有默认的样式 fill: #000;
下面的也都一样
圆形
1 2 |
|
r 半径
cx,cy 圆心坐标
1 |
|
椭圆
1 2 |
|
rx,ry 长半径/短半径
cx,cy 圆心坐标
1 |
|
折线
1 2 |
|
points指定折线经过的点
横纵坐标空格隔开
多个坐标间逗号隔开
1 |
|
多边形
1 2 |
|
和上面的折线差不多
只不过它的终点会连接起点
形成闭合的效果
类似于canvas中的closePath()
1 |
|
文本
1 2 |
|
x,y 文本起始坐标(左下)
1 |
|
路径命令
路径需要用path标签
它有一个属性d,我们可以添加指令来完成绘图
这要比我们上面的绘制方法简洁许多
M/m命令与L/l命令
1 2 |
|
1 2 |
|
在这两个指令中,产生的路径是一样的
M指令相当于canvas中的moveTo()指定起始点坐标
L指令相当于canvas中的lineTo()指定中/终点坐标
区别是,M/L指令是绝对坐标(相对于svg坐标原点定位)
而m/l指令是相对坐标(相对于上一个点定位)
当然还需要添加css样式才可以绘制
1 |
|
H/h命令与V/v命令
这两个指令用来执行水平绘制与垂直绘制
同样H与V是绝对指令,h与v是相对指令
1 2 |
|
等价于
1 2 |
|
有默认fill样式,修改为透明
1 |
|
指定了路径原点100,100
然后水平向右移动了100px,又垂直向下移动了100px
Z/z命令
z与Z命令没有任何区别
线段绘制完毕后,添加z命令
会连接起点与终点,闭合曲线
类似于canvas中的closePath()
1 2 |
|
1 |
|
A/a命令
A/a命令用来绘制弧,它有7个参数
与canvas绘制方式不同,它更强大并且复杂
首先看看这7个参数
rx、ry、x-axis-rotation、large-arc-flag、sweep-flag、x、y
rx,ry 表示绘制圆弧的x轴半径和y轴半径
x-axis-rotation 表示圆弧相对x轴的旋转角度,默认顺时针,可以是负值
large-arc-flag 表示圆弧路径是大圆弧还是小圆弧(1大圆弧、0小圆弧)
sweep-flag 表示起点到终点是顺时针还是逆时针(1顺时针、0逆时针)
x,y 终点坐标(A命令绝对坐标、a命令相对坐标)
只是看这些可能不好理解我来举个例子给大家解释一下
其实只要把这个圆弧看成是椭圆的一部分就好理解了
1 2 |
|
1 |
|
这个例子中弧的起点是100,100
终点是200,200这个不难理解
A指令中前两个参数 100 50
就相当于我先画了一个100×50的椭圆
第三个参数90
便是将这个椭圆顺时针旋转90°
根据起点与终点
此时椭圆可以拆分为一个短路径和一个长路径
第四个参数1
便是表示选取较长的路径作为弧
第五个参数1
表示路径的方向为顺时针
贝塞尔曲线指令Q/T、C/S
二次贝塞尔曲线指令
Q x1 y1 , x y
T x y
三次贝塞尔曲线指令
C x1 y1 , x2 y2 , x y
S x2 y2 , x y
Q命令绘制到(x,y)的二次贝塞尔曲线,(x1,y1)为控制点
T命令绘制到(x,y)的二次贝塞尔曲线,控制点是前一个Q命令控制点的中心对称点
如果没有前一条曲线,当前点会被用作控制点。绘制出来的曲线更流畅
C命令绘制到(x,y)的三次贝塞尔曲线,(x1,y1)(x2,y2)为控制点
S命令绘制到(x,y)的三次贝塞尔曲线,(x2,y2)为新端点的控制点
第一个控制点是前一个C命令控制点的中心对称点
如果没有前一条曲线,当前点会被用作控制点。绘制出来的曲线更流畅
1 2 |
|
1 |
|
关于贝塞尔曲线的数学解释我在canvas写过了
这里就不再说了 → 传送门
SVG样式属性
关于svg的css样式属性
类比于canvas中环境对象的属性
它们含义都是类似的,不多做解释了
fill
stroke
stroke-width
stroke/fill-opacity
stroke-linecap
stroke-linejoin
以上就是SVG(可缩放矢量图形)基本图形绘制方法与path路径命令的内容,更多相关内容请关注PHP中文网(www.php.cn)!

Hot AI Tools

Undresser.AI Undress
AI-powered app for creating realistic nude photos

AI Clothes Remover
Online AI tool for removing clothes from photos.

Undress AI Tool
Undress images for free

Clothoff.io
AI clothes remover

Video Face Swap
Swap faces in any video effortlessly with our completely free AI face swap tool!
Hot Article
Hot Tools

Notepad++7.3.1
Easy-to-use and free code editor

SublimeText3 Chinese version
Chinese version, very easy to use

Zend Studio 13.0.1
Powerful PHP integrated development environment

Dreamweaver CS6
Visual web development tools

SublimeText3 Mac version
God-level code editing software (SublimeText3)
Hot Topics
 1658
1658
 14
1415
52
1309
25
1257
29
1231
24
14
1415
52
1309
25
1257
29
1231
24

 Steps to set the PATH environment variable of the Linux system
Feb 18, 2024 pm 05:40 PM
Steps to set the PATH environment variable of the Linux system
Feb 18, 2024 pm 05:40 PM
How to set the PATH environment variable in Linux systems In Linux systems, the PATH environment variable is used to specify the path where the system searches for executable files on the command line. Correctly setting the PATH environment variable allows us to execute system commands and custom commands at any location. This article will introduce how to set the PATH environment variable in a Linux system and provide detailed code examples. View the current PATH environment variable. Execute the following command in the terminal to view the current PATH environment variable: echo$P
 Let's talk about how to use SVG to achieve image mosaic effect
Sep 01, 2022 am 11:05 AM
Let's talk about how to use SVG to achieve image mosaic effect
Sep 01, 2022 am 11:05 AM
How to use SVG to achieve image mosaic effect without using Javascript? The following article will give you a detailed understanding, I hope it will be helpful to you!
 An in-depth analysis of how to use svg icons in vue3+vite
Apr 28, 2022 am 10:48 AM
An in-depth analysis of how to use svg icons in vue3+vite
Apr 28, 2022 am 10:48 AM
svg images are widely used in projects. The following article will introduce how to use svg icons in vue3 + vite. I hope it will be helpful to everyone!
 How to convert svg to jpg format
Nov 24, 2023 am 09:50 AM
How to convert svg to jpg format
Nov 24, 2023 am 09:50 AM
svg can be converted to jpg format by using image processing software, using online conversion tools, and using the Python image processing library. Detailed introduction: 1. Image processing software includes Adobe Illustrator, Inkscape and GIMP; 2. Online conversion tools include CloudConvert, Zamzar, Online Convert, etc.; 3. Python image processing library, etc.
 How to set the path environment variable
Sep 04, 2023 am 11:53 AM
How to set the path environment variable
Sep 04, 2023 am 11:53 AM
Method to set the path environment variable: 1. Windows system, open "System Properties", click the "Properties" option, click "Advanced System Settings", in the "System Properties" window, select the "Advanced" tab, and then click "Environment Variables" " button, find and click "Path" to edit and save; 2. For Linux systems, open the terminal, open your bash configuration file, add "export PATH=$PATH: file path" at the end of the file and save it; 3. For MacOS system, the operation is the same as above.
 How to correctly set the PATH environment variable in Linux
Feb 22, 2024 pm 08:57 PM
How to correctly set the PATH environment variable in Linux
Feb 22, 2024 pm 08:57 PM
How to correctly set the PATH environment variable in Linux In the Linux operating system, environment variables are one of the important mechanisms used to store system-level configuration information. Among them, the PATH environment variable is used to specify the directories in which the system searches for executable files. Correctly setting the PATH environment variable is a key step to ensure the normal operation of the system. This article will introduce how to correctly set the PATH environment variable in Linux and provide specific code examples. 1. Check the current PATH environment variable and enter the following command in the terminal
 How to configure path environment variable in java
Nov 15, 2023 pm 01:20 PM
How to configure path environment variable in java
Nov 15, 2023 pm 01:20 PM
Configuration steps: 1. Find the Java installation directory; 2. Find the system environment variable settings; 3. In the environment variable window, find the variable named "Path" and click the edit button; 4. In the pop-up edit environment variable window , click the "New" button, and enter the Java installation path in the pop-up dialog box; 5. After confirming that the input is correct, click the "OK" button.
 The role and importance of the PATH environment variable in Linux
Feb 21, 2024 pm 02:09 PM
The role and importance of the PATH environment variable in Linux
Feb 21, 2024 pm 02:09 PM
"The Role and Importance of the PATH Environment Variable in Linux" The PATH environment variable is one of the very important environment variables in the Linux system. It defines which directories the system searches for executable programs. In the Linux system, when the user enters a command in the terminal, the system will search one by one in the directories listed in the PATH environment variable to see if the executable file of the command exists. If found, it will be executed. Otherwise, "commandnotfound" will be prompted. The role of the PATH environment variable: Simplified
