
 System Tutorial
LINUX
Detailed explanation of MySQL performance indicators and calculation methods
System Tutorial
LINUX
Detailed explanation of MySQL performance indicators and calculation methods
Detailed explanation of MySQL performance indicators and calculation methods

Most MySQL performance indicators can be obtained in the following two ways:
MySQL performance indicators obtained using the mysqladmin extended-status command default to cumulative values. If you want to understand the current status, you need to calculate the difference; add the parameter --relative(-r), you can see the difference of each indicator, and use the parameter --sleep(-i) Specify how often to refresh.

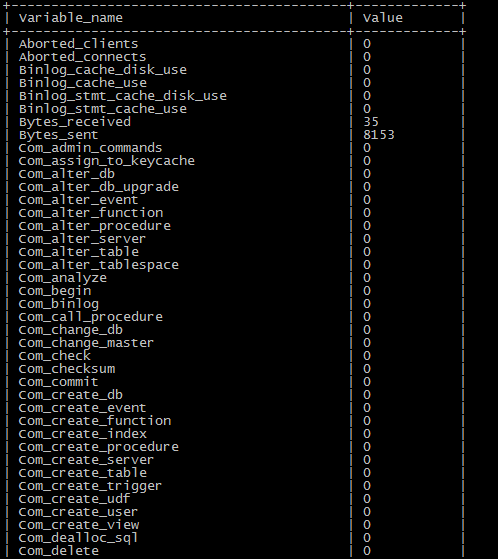
Can list various status values of MySQL server running, cumulative value.
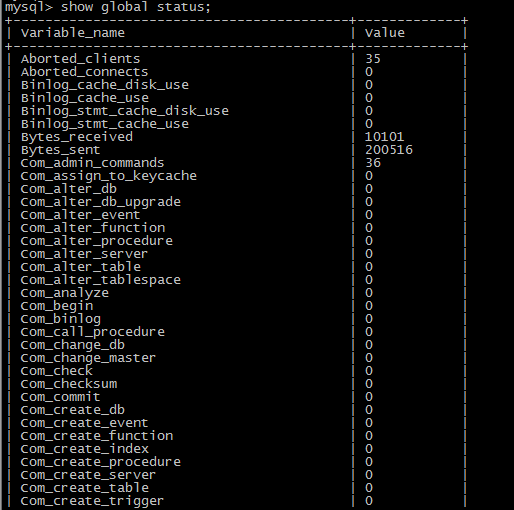
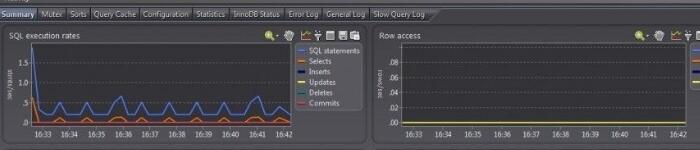
Mysqladmin extended-status command and show global status get a lot of indicator items. In practical applications, focus on the following performance indicators:
tps: Transactions Per Second, number of transactions per second;
qps: Queries Per Second Number of queries per second;
There are usually two ways to calculate tps/qps:
Method 1: Calculate tps based on com_commit and com_rollback, and calculate qps based on questions.
TPS = Com_commit/s Com_rollback/s
in,
Com_commit /s= mysqladmin extended-status --relative --sleep=1|grep -w Com_commit
Com_rollback/s = mysqladmin extended-status --relative --sleep=1|grep -w Com_rollback
QPS refers to the total amount of Query executed by MySQL Server per second, which is approximately represented by the change in the Questions (number of customer queries) status value per second, so there are:
QPS = mysqladmin extended-status --relative --sleep=1|grep -w Questions
You can also get the number of mysql select, insert, update, delete, etc. per second by following the above method, such as:
Com_select/s = mysqladmin extended-status --relative --sleep=1|grep -w Com_select
Com_select/s: Average number of select statement executions per second
Com_insert/s: average number of insert statement executions per second
Com_update/s: Average number of update statement executions per second
Com_delete/s: average number of delete statement executions per second
Method 2: Calculate tps based on com_%, qps
tps= Com_insert/s Com_update/s Com_delete/s
qps=Com_select/s Com_insert/s Com_update/s Com_delete/s
threads_running: The number of threads currently active
threads_connected: The number of currently connected threads
Bytes_received/s: Average number of bytes received from all clients per second, unit KB
Bytes_sent/s: The average number of bytes sent to all clients per second, unit KB
innodb_data_reads: The average number of times innodb reads from the file per second
innodb_data_writes: The average number of times innodb writes from the file per second
innodb_data_fsyncs: The average number of fsync() operations performed by innodb per second
innodb_data_read: The average amount of data read by innodb per second, in KB
innodb_data_written: The average amount of data written by innodb per second, in KB
innodb_buffer_pool_reads: Average number of pages read from the physical disk per second
innodb_buffer_pool_read_requests: Average number of reads from the innodb buffer pool per second (number of logical read requests)
innodb_buffer_pool_write_requests: Average number of writes to the innodb buffer pool per second
innodb_buffer_pool_pages_dirty: The average number of dirty pages in the innodb cache pool per second
innodb_buffer_pool_pages_flushed: The average number of page refresh requests in the innodb cache pool per second
Innodb buffer pool read hit rate
innodb_buffer_read_hit_ratio = ( 1 - Innodb_buffer_pool_reads/Innodb_buffer_pool_read_requests) * 100
Innodb buffer pool utilization
Innodb_buffer_usage = ( 1 - Innodb_buffer_pool_pages_free / Innodb_buffer_pool_pages_total) * 100
innodb_os_log_fsyncs: Average number of fsync() writes to the log file per second
innodb_os_log_written: Average number of bytes written to the log file per second
innodb_log_writes: Average number of physical writes to the log file per second
innodb_log_write_requests: Average number of log write requests per second
innodb_rows_deleted: The average number of rows deleted from the innodb table per second
innodb_rows_inserted: Average number of rows inserted from the innodb table per second
innodb_rows_read: The average number of rows read from the innodb table per second
innodb_rows_updated: The average number of rows updated from the innodb table per second
innodb_row_lock_waits: The number of times a row must wait for a lock
innodb_row_lock_time: The total time spent on row locking, in milliseconds
innodb_row_lock_time_avg: average row lock time, in milliseconds
key_read_requests: The average number of MyISAM reads from the buffer pool per second
Key_write_requests: The average number of MyISAM writes from the buffer pool per second
key_reads: The average number of times MyISAM reads from the hard disk per second
key_writes: The average number of times MyISAM writes from the hard disk per second
MyISAM average key buffer utilization per second
Key_usage_ratio =Key_blocks_used/(Key_blocks_used Key_blocks_unused)*100
MyISAM average key buffer read hit rate per second
Key_read_hit_ratio=(1-Key_reads/Key_read_requests)*100
MyISAM average key buffer write hit rate per second
Key_write_hit_ratio =(1-Key_writes/Key_write_requests)*100
Created_tmp_disk_tables: The number of temporary tables automatically created on the hard disk when the server executes a statement
Created_tmp_tables: The number of temporary tables in memory that are automatically created when the server executes a statement
The ratio of Created_tmp_disk_tables/Created_tmp_tables should not exceed 10%. If the value of Created_tmp_tables is relatively large, there may be too many sorting sentences or the connection sentences are not optimized enough
slow_queries: Number of queries whose execution time exceeds long_query_time seconds (important)
sort_rows: Number of sorted rows
open_files: Number of open files
open_tables: Number of currently open tables
select_scan: The number of joins for a full scan of the first table
In addition, there are some performance indicators that cannot be obtained directly through mysqladmin extended-status or show global status, but they are very important.
Percona provides the tcprstat tool to count response times. This function is turned off by default. This function can be turned on by setting the parameter query_response_time_stats=1.
There are two ways to check the response time:
(1) View response time statistics through the command SHOW QUERY_RESPONSE_TIME;
(2) View through the table QUERY_RESPONSE_TIME in INFORMATION_SCHEMA.
http://www.orczhou.com/index.php/2011/09/thanks-percona-response-time-distribution/comment-page-1/(reference article)
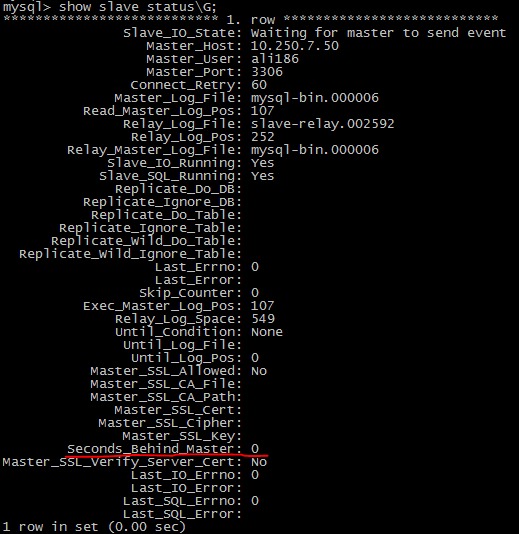
You can execute the show slave status\G command on the slave node. The value of the Seconds_Behind_Master item is the current delay of the slave, in seconds.
The above is the detailed content of Detailed explanation of MySQL performance indicators and calculation methods. For more information, please follow other related articles on the PHP Chinese website!

Hot AI Tools

Undresser.AI Undress
AI-powered app for creating realistic nude photos

AI Clothes Remover
Online AI tool for removing clothes from photos.

Undress AI Tool
Undress images for free

Clothoff.io
AI clothes remover

Video Face Swap
Swap faces in any video effortlessly with our completely free AI face swap tool!

Hot Article
Hot Tools

Notepad++7.3.1
Easy-to-use and free code editor

SublimeText3 Chinese version
Chinese version, very easy to use

Zend Studio 13.0.1
Powerful PHP integrated development environment

Dreamweaver CS6
Visual web development tools

SublimeText3 Mac version
God-level code editing software (SublimeText3)
Hot Topics
 1653
1653
 14
1413
52
1304
25
1251
29
1224
24
14
1413
52
1304
25
1251
29
1224
24

 Linux Architecture: Unveiling the 5 Basic Components
Apr 20, 2025 am 12:04 AM
Linux Architecture: Unveiling the 5 Basic Components
Apr 20, 2025 am 12:04 AM
The five basic components of the Linux system are: 1. Kernel, 2. System library, 3. System utilities, 4. Graphical user interface, 5. Applications. The kernel manages hardware resources, the system library provides precompiled functions, system utilities are used for system management, the GUI provides visual interaction, and applications use these components to implement functions.
 vscode terminal usage tutorial
Apr 15, 2025 pm 10:09 PM
vscode terminal usage tutorial
Apr 15, 2025 pm 10:09 PM
vscode built-in terminal is a development tool that allows running commands and scripts within the editor to simplify the development process. How to use vscode terminal: Open the terminal with the shortcut key (Ctrl/Cmd). Enter a command or run the script. Use hotkeys (such as Ctrl L to clear the terminal). Change the working directory (such as the cd command). Advanced features include debug mode, automatic code snippet completion, and interactive command history.
 How to check the warehouse address of git
Apr 17, 2025 pm 01:54 PM
How to check the warehouse address of git
Apr 17, 2025 pm 01:54 PM
To view the Git repository address, perform the following steps: 1. Open the command line and navigate to the repository directory; 2. Run the "git remote -v" command; 3. View the repository name in the output and its corresponding address.
 Where to write code in vscode
Apr 15, 2025 pm 09:54 PM
Where to write code in vscode
Apr 15, 2025 pm 09:54 PM
Writing code in Visual Studio Code (VSCode) is simple and easy to use. Just install VSCode, create a project, select a language, create a file, write code, save and run it. The advantages of VSCode include cross-platform, free and open source, powerful features, rich extensions, and lightweight and fast.
 How to run java code in notepad
Apr 16, 2025 pm 07:39 PM
How to run java code in notepad
Apr 16, 2025 pm 07:39 PM
Although Notepad cannot run Java code directly, it can be achieved by using other tools: using the command line compiler (javac) to generate a bytecode file (filename.class). Use the Java interpreter (java) to interpret bytecode, execute the code, and output the result.
 What is the main purpose of Linux?
Apr 16, 2025 am 12:19 AM
What is the main purpose of Linux?
Apr 16, 2025 am 12:19 AM
The main uses of Linux include: 1. Server operating system, 2. Embedded system, 3. Desktop operating system, 4. Development and testing environment. Linux excels in these areas, providing stability, security and efficient development tools.
 vscode terminal command cannot be used
Apr 15, 2025 pm 10:03 PM
vscode terminal command cannot be used
Apr 15, 2025 pm 10:03 PM
Causes and solutions for the VS Code terminal commands not available: The necessary tools are not installed (Windows: WSL; macOS: Xcode command line tools) Path configuration is wrong (add executable files to PATH environment variables) Permission issues (run VS Code as administrator) Firewall or proxy restrictions (check settings, unrestrictions) Terminal settings are incorrect (enable use of external terminals) VS Code installation is corrupt (reinstall or update) Terminal configuration is incompatible (try different terminal types or commands) Specific environment variables are missing (set necessary environment variables)
 How to run sublime after writing the code
Apr 16, 2025 am 08:51 AM
How to run sublime after writing the code
Apr 16, 2025 am 08:51 AM
There are six ways to run code in Sublime: through hotkeys, menus, build systems, command lines, set default build systems, and custom build commands, and run individual files/projects by right-clicking on projects/files. The build system availability depends on the installation of Sublime Text.
