

Let me go, the Linux system CPU is 100% full!

Yesterday afternoon, I suddenly received an email alert from the operation and maintenance department, which showed that the CPU utilization rate of the data platform server was as high as 98.94%. In recent times, this utilization rate has continued to be above 70%. At first glance, it seems that the hardware resources have reached a bottleneck and need to be expanded. But after thinking about it carefully, I found that our business system is not a highly concurrent or CPU-intensive application. This utilization rate is too exaggerated, and the hardware bottleneck cannot be reached so quickly. There must be a problem with the business code logic somewhere.
2. Troubleshooting ideas
2.1 Locate high load process pid
First log in to the server and use the top command to confirm the specific situation of the server, and then analyze and judge based on the specific situation.

By observing the load average and the load evaluation standard (8 cores), it can be confirmed that the server has a high load;

Observing the resource usage of each process, we can see that the process with process ID 682 has a higher CPU ratio
2.2 Locate specific abnormal business
Here we can use the pwdx command to find the business process path based on pid, and then locate the person in charge and the project:
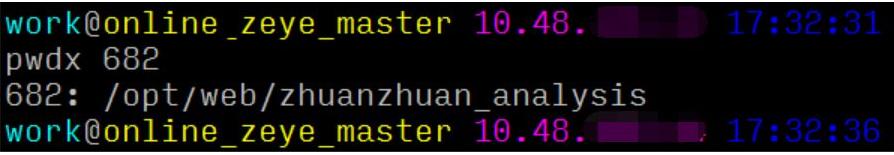
It can be concluded that this process corresponds to the web service of the data platform.
2.3 Locate the abnormal thread and specific code lines
The traditional solution is generally 4 steps:
1. top oder by with P:1040 //First sort by process load and find maxLoad(pid)
2. top -Hp process PID: 1073 // Find the relevant load thread PID
3. printf "0x%x" Thread PID: 0x431 // Convert the thread PID to hexadecimal to prepare for later searching for jstack logs
4. jstack process PID | vim /hex thread PID – // For example: jstack 1040|vim /0x431 –
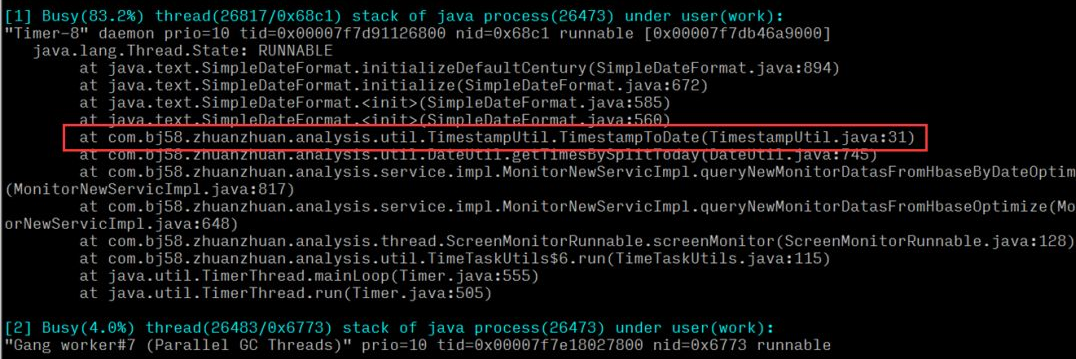
But for online problem locating, every second counts, and the above four steps are still too cumbersome and time-consuming. Oldratlee, who introduced Taobao before, encapsulated the above process into a tool: show-busy-java-threads. sh, you can easily locate this type of problem online:

It can be concluded that the execution CPU of a time tool method in the system is relatively high. After locating the specific method, check whether there are performance problems in the code logic.
※ If the online problem is more urgent, you can omit 2.1 and 2.2 and directly execute 2.3. The analysis here is from multiple angles just to present you with a complete analysis idea.
3. Root cause analysis
After the previous analysis and troubleshooting, we finally located a problem with time tools, which caused excessive server load and CPU usage.
- Exception method logic: is to convert the timestamp into the corresponding specific date and time format;
- Upper layer call: Calculate all the seconds from early morning to the current time, convert them into the corresponding format and put them into the set to return the result;
- Logic layer: corresponds to the query logic of the real-time report of the data platform. The real-time report will come at a fixed time interval, and there will be multiple (n) method calls in one query.
Then it can be concluded that if the current time is 10 a.m. that day, the number of calculations for a query is 106060n times = 36,000n calculations, and As time goes by, the number of single queries increases linearly as it gets closer to midnight. Since a large number of query requests from modules such as real-time query and real-time alarm require calling this method multiple times, a large amount of CPU resources are occupied and wasted.
4. Solution
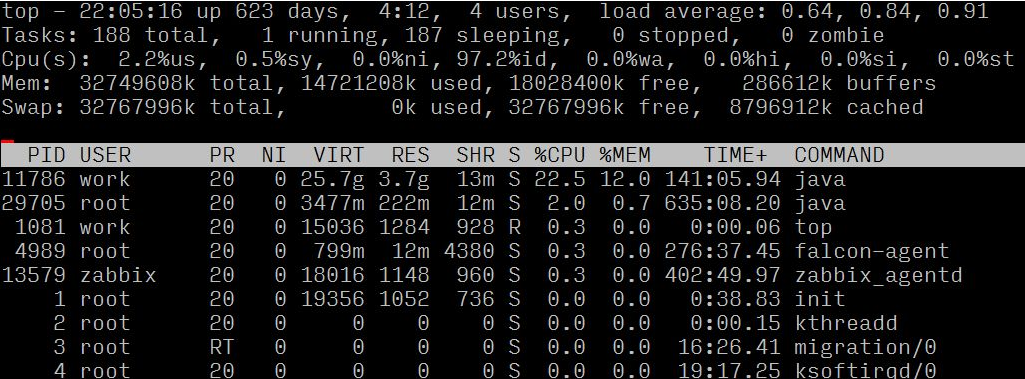
After locating the problem, the first consideration is to reduce the number of calculations and optimize the exception method. After investigation, it was found that when used at the logic layer, the contents of the set collection returned by this method were not used, but the size value of the set was simply used. After confirming the logic, simplify the calculation through a new method (current seconds - seconds in the early morning of the day), replace the called method, and solve the problem of excessive calculations. After going online, we observed the server load and CPU usage. Compared with the abnormal time period, the server load and CPU usage dropped by 30 times and returned to normal. At this point, the problem has been solved.

By observing the load average and the load evaluation standard (8 cores), it can be confirmed that the server has a high load;
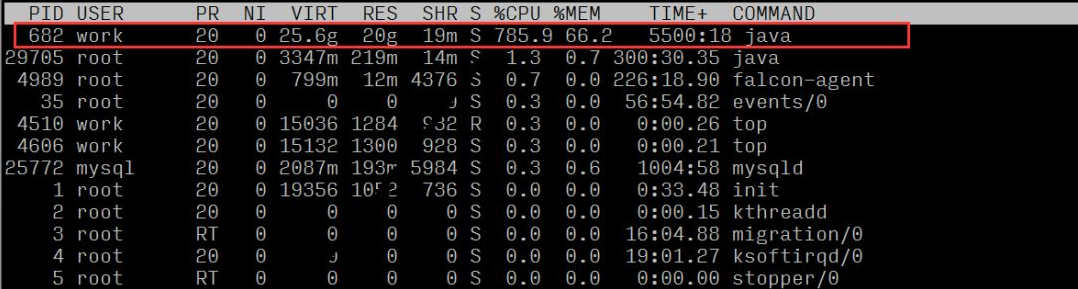
Observing the resource usage of each process, we can see that the process with process ID 682 has a higher CPU ratio
2.2 Locate specific abnormal business
Here we can use the pwdx command to find the business process path based on pid, and then locate the person in charge and the project:

It can be concluded that this process corresponds to the web service of the data platform.
2.3 Locate the abnormal thread and specific code lines
The traditional solution is generally 4 steps:
1. top oder by with P:1040 //First sort by process load and find maxLoad(pid)
2. top -Hp process PID: 1073 // Find the relevant load thread PID
3. printf "0x%x" Thread PID: 0x431 // Convert the thread PID to hexadecimal to prepare for later searching for jstack logs
4. jstack process PID | vim /hex thread PID – // For example: jstack 1040|vim /0x431 –
But for online problem locating, every second counts, and the above four steps are still too cumbersome and time-consuming. Oldratlee, who introduced Taobao before, encapsulated the above process into a tool: show-busy-java-threads. sh, you can easily locate this type of problem online:
It can be concluded that the execution CPU of a time tool method in the system is relatively high. After locating the specific method, check whether there are performance problems in the code logic.
※ If the online problem is more urgent, you can omit 2.1 and 2.2 and directly execute 2.3. The analysis here is from multiple angles just to present you with a complete analysis idea.
3. Root cause analysis
After the previous analysis and troubleshooting, we finally located a problem with time tools, which caused excessive server load and CPU usage.
- Exception method logic: is to convert the timestamp into the corresponding specific date and time format;
- Upper layer call: Calculate all the seconds from early morning to the current time, convert them into the corresponding format and put them into the set to return the result;
- Logic layer: corresponds to the query logic of the real-time report of the data platform. The real-time report will come at a fixed time interval, and there will be multiple (n) method calls in one query.
Then it can be concluded that if the current time is 10 a.m. that day, the number of calculations for a query is 106060n times = 36,000n calculations, and As time goes by, the number of single queries increases linearly as it gets closer to midnight. Since a large number of query requests from modules such as real-time query and real-time alarm require calling this method multiple times, a large amount of CPU resources are occupied and wasted.
4. Solution
After locating the problem, the first consideration is to reduce the number of calculations and optimize the exception method. After investigation, it was found that when used at the logic layer, the contents of the set collection returned by this method were not used, but the size value of the set was simply used. After confirming the logic, simplify the calculation through a new method (current seconds - seconds in the early morning of the day), replace the called method, and solve the problem of excessive calculations. After going online, we observed the server load and CPU usage. Compared with the abnormal time period, the server load and CPU usage dropped by 30 times and returned to normal. At this point, the problem has been solved.
5. Summary
- During the coding process, in addition to implementing business logic, we must also focus on optimizing code performance. The ability to realize a business requirement and the ability to achieve it more efficiently and more elegantly are actually two completely different manifestations of engineers' abilities and realms, and the latter is also the core competitiveness of engineers.
- After the code is written, do more reviews and think more about whether it can be implemented in a better way.
- Don’t miss any small detail in online questions! Details are the devil. Technical students need to have the thirst for knowledge and the spirit of pursuing excellence. Only in this way can they continue to grow and improve.
The above is the detailed content of Let me go, the Linux system CPU is 100% full!. For more information, please follow other related articles on the PHP Chinese website!

Hot AI Tools

Undresser.AI Undress
AI-powered app for creating realistic nude photos

AI Clothes Remover
Online AI tool for removing clothes from photos.

Undress AI Tool
Undress images for free

Clothoff.io
AI clothes remover

Video Face Swap
Swap faces in any video effortlessly with our completely free AI face swap tool!

Hot Article
Hot Tools

Notepad++7.3.1
Easy-to-use and free code editor

SublimeText3 Chinese version
Chinese version, very easy to use

Zend Studio 13.0.1
Powerful PHP integrated development environment

Dreamweaver CS6
Visual web development tools

SublimeText3 Mac version
God-level code editing software (SublimeText3)
Hot Topics


 What computer configuration is required for vscode
Apr 15, 2025 pm 09:48 PM
What computer configuration is required for vscode
Apr 15, 2025 pm 09:48 PM
VS Code system requirements: Operating system: Windows 10 and above, macOS 10.12 and above, Linux distribution processor: minimum 1.6 GHz, recommended 2.0 GHz and above memory: minimum 512 MB, recommended 4 GB and above storage space: minimum 250 MB, recommended 1 GB and above other requirements: stable network connection, Xorg/Wayland (Linux)
 Linux Architecture: Unveiling the 5 Basic Components
Apr 20, 2025 am 12:04 AM
Linux Architecture: Unveiling the 5 Basic Components
Apr 20, 2025 am 12:04 AM
The five basic components of the Linux system are: 1. Kernel, 2. System library, 3. System utilities, 4. Graphical user interface, 5. Applications. The kernel manages hardware resources, the system library provides precompiled functions, system utilities are used for system management, the GUI provides visual interaction, and applications use these components to implement functions.
 vscode terminal usage tutorial
Apr 15, 2025 pm 10:09 PM
vscode terminal usage tutorial
Apr 15, 2025 pm 10:09 PM
vscode built-in terminal is a development tool that allows running commands and scripts within the editor to simplify the development process. How to use vscode terminal: Open the terminal with the shortcut key (Ctrl/Cmd). Enter a command or run the script. Use hotkeys (such as Ctrl L to clear the terminal). Change the working directory (such as the cd command). Advanced features include debug mode, automatic code snippet completion, and interactive command history.
 How to check the warehouse address of git
Apr 17, 2025 pm 01:54 PM
How to check the warehouse address of git
Apr 17, 2025 pm 01:54 PM
To view the Git repository address, perform the following steps: 1. Open the command line and navigate to the repository directory; 2. Run the "git remote -v" command; 3. View the repository name in the output and its corresponding address.
 Where to write code in vscode
Apr 15, 2025 pm 09:54 PM
Where to write code in vscode
Apr 15, 2025 pm 09:54 PM
Writing code in Visual Studio Code (VSCode) is simple and easy to use. Just install VSCode, create a project, select a language, create a file, write code, save and run it. The advantages of VSCode include cross-platform, free and open source, powerful features, rich extensions, and lightweight and fast.
 How to run java code in notepad
Apr 16, 2025 pm 07:39 PM
How to run java code in notepad
Apr 16, 2025 pm 07:39 PM
Although Notepad cannot run Java code directly, it can be achieved by using other tools: using the command line compiler (javac) to generate a bytecode file (filename.class). Use the Java interpreter (java) to interpret bytecode, execute the code, and output the result.
 What is the main purpose of Linux?
Apr 16, 2025 am 12:19 AM
What is the main purpose of Linux?
Apr 16, 2025 am 12:19 AM
The main uses of Linux include: 1. Server operating system, 2. Embedded system, 3. Desktop operating system, 4. Development and testing environment. Linux excels in these areas, providing stability, security and efficient development tools.
 How to run sublime after writing the code
Apr 16, 2025 am 08:51 AM
How to run sublime after writing the code
Apr 16, 2025 am 08:51 AM
There are six ways to run code in Sublime: through hotkeys, menus, build systems, command lines, set default build systems, and custom build commands, and run individual files/projects by right-clicking on projects/files. The build system availability depends on the installation of Sublime Text.
