

Summary of methods to check memory usage under Linux

Q: I have a question, I want to monitor the memory usage of my Linux system. What views or command line tools are available under Linux?
A: In Linux systems, there are many ways to monitor memory usage. Here are some ways to view memory usage through view tools or the command line.
-
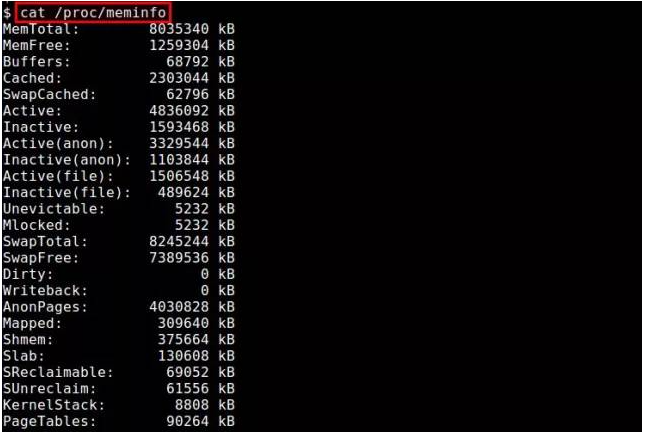
/proc/meminfo: The easiest way is to look at the/proc/meminfofile. This virtual file updates dynamically and provides detailed information about memory usage. It lists various memory metrics to cover most of your memory usage needs. In addition, you can also view the memory usage information of the process through/proc/<pid>/statm</pid>and/proc/<pid>/status</pid>. -
freeCommand: This command can display the memory usage in the system, including used memory, free memory, cache and swap space, etc. You can use thefree -hcommand to display memory usage in a human-readable way. -
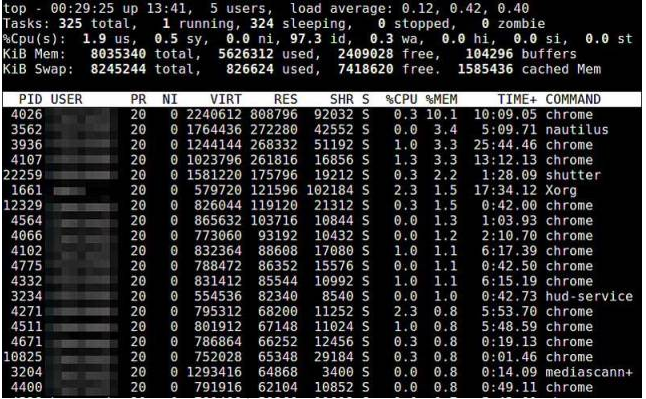
topCommand:topThe command can display various performance indicators of the system in real time, including memory usage. You can use thetopcommand and press theShift mkey to sort processes by memory usage. -
htopTool:htopis an interactive process viewing tool that can display various performance indicators of the system, including memory usage, in a more friendly way. You can use thesudo apt install htopcommand to install and runhtop. -
glancesTool:glancesis a versatile system monitoring tool that can summarize and display various performance indicators of the system, including memory usage. You can use thesudo apt install glancescommand to install and runglances.
These tools and commands provide different ways to monitor the memory usage of Linux systems. You can choose the appropriate tool to use according to your needs. Hope this information is helpful to you!
$ cat /proc/meminfoCopy after login
2.atop
atop command is a terminal environment monitoring command. It shows a combination of various system resources (CPU, memory, network, I/O, kernel) and is color-coded under high load conditions.
$ sudo atopCopy after login

3.free
The free command is a quick way to view memory usage. It is an overview of the information collected by /proc/meminfo.
$ free -hCopy after login

4.GNOME System Monitor
GNOME System Monitor is a view tool that displays the usage of CPU, memory, swap area and network in the recent period. It also provides a way to view CPU and memory usage.
$ gnome-system-monitorCopy after login

5.htop
The htop command displays the real-time memory usage of each process. It provides reports on the resident memory size of all processes, total program memory size, shared library size, etc. The list can be scrolled horizontally and vertically.
$ htopCopy after login

6.KDE System Monitor
The functions are the same as the GENOME version introduced in 4.
$ ksysguardCopy after login

7.memstat
memstat is a command that effectively identifies the use of virtual memory by executable(s), process(es) and shared libraries. Given a process ID, memstat can list the executable files, data and shared libraries associated with this process.
$ memstat -pCopy after login

8.nmon
nmon是一个基于ncurses的系统基准测试工具,它可以监控CPU、内存、I/O、文件系统及网络资源等的互动模式。对于内存的使用,它可以实时的显示 总/剩余内存、交换空间等信息。
$ nmonCopy after login

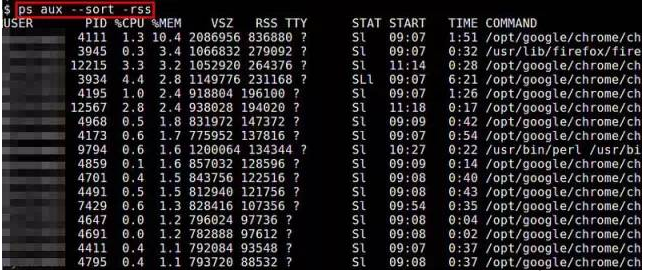
9.ps
ps命令可以实时的显示各个进程的内存使用情况。Reported memory usage information includes %MEM (percent of physical memory used), VSZ (total amount of virtual memory used), and RSS (total amount of physical memory used)。你可以使用 “–sort”选项对进程进行排序,例如按RSS进行排序:
$ ps aux --sort -rssCopy after login
10.smem
smem命令允许你统计基于/proc信息的不同进程和用户的内存使用情况。内存使用情况的分析可以导出图表(如条形图和饼图)。
$ sudo smem --pie name -c "pss"Copy after login

11.top
top命令提供了实时的运行中的程序的资源使用统计。你可以根据内存的使用和大小来进行排序。
$ topCopy after login
12.vmstat
vmstat命令显示实时的和平均的统计,覆盖CPU、内存、I/O等内容。例如内存情况,不仅显示物理内存,也统计虚拟内存。
$ vmstat -sCopy after login
The above is the detailed content of Summary of methods to check memory usage under Linux. For more information, please follow other related articles on the PHP Chinese website!

Hot AI Tools

Undresser.AI Undress
AI-powered app for creating realistic nude photos

AI Clothes Remover
Online AI tool for removing clothes from photos.

Undress AI Tool
Undress images for free

Clothoff.io
AI clothes remover

Video Face Swap
Swap faces in any video effortlessly with our completely free AI face swap tool!

Hot Article
Hot Tools

Notepad++7.3.1
Easy-to-use and free code editor

SublimeText3 Chinese version
Chinese version, very easy to use

Zend Studio 13.0.1
Powerful PHP integrated development environment

Dreamweaver CS6
Visual web development tools

SublimeText3 Mac version
God-level code editing software (SublimeText3)
Hot Topics
 1653
1653
 14
1413
52
1306
25
1251
29
1224
24
14
1413
52
1306
25
1251
29
1224
24

 Linux Architecture: Unveiling the 5 Basic Components
Apr 20, 2025 am 12:04 AM
Linux Architecture: Unveiling the 5 Basic Components
Apr 20, 2025 am 12:04 AM
The five basic components of the Linux system are: 1. Kernel, 2. System library, 3. System utilities, 4. Graphical user interface, 5. Applications. The kernel manages hardware resources, the system library provides precompiled functions, system utilities are used for system management, the GUI provides visual interaction, and applications use these components to implement functions.
 vscode terminal usage tutorial
Apr 15, 2025 pm 10:09 PM
vscode terminal usage tutorial
Apr 15, 2025 pm 10:09 PM
vscode built-in terminal is a development tool that allows running commands and scripts within the editor to simplify the development process. How to use vscode terminal: Open the terminal with the shortcut key (Ctrl/Cmd). Enter a command or run the script. Use hotkeys (such as Ctrl L to clear the terminal). Change the working directory (such as the cd command). Advanced features include debug mode, automatic code snippet completion, and interactive command history.
 Where to write code in vscode
Apr 15, 2025 pm 09:54 PM
Where to write code in vscode
Apr 15, 2025 pm 09:54 PM
Writing code in Visual Studio Code (VSCode) is simple and easy to use. Just install VSCode, create a project, select a language, create a file, write code, save and run it. The advantages of VSCode include cross-platform, free and open source, powerful features, rich extensions, and lightweight and fast.
 How to check the warehouse address of git
Apr 17, 2025 pm 01:54 PM
How to check the warehouse address of git
Apr 17, 2025 pm 01:54 PM
To view the Git repository address, perform the following steps: 1. Open the command line and navigate to the repository directory; 2. Run the "git remote -v" command; 3. View the repository name in the output and its corresponding address.
 How to run java code in notepad
Apr 16, 2025 pm 07:39 PM
How to run java code in notepad
Apr 16, 2025 pm 07:39 PM
Although Notepad cannot run Java code directly, it can be achieved by using other tools: using the command line compiler (javac) to generate a bytecode file (filename.class). Use the Java interpreter (java) to interpret bytecode, execute the code, and output the result.
 What is the main purpose of Linux?
Apr 16, 2025 am 12:19 AM
What is the main purpose of Linux?
Apr 16, 2025 am 12:19 AM
The main uses of Linux include: 1. Server operating system, 2. Embedded system, 3. Desktop operating system, 4. Development and testing environment. Linux excels in these areas, providing stability, security and efficient development tools.
 vscode terminal command cannot be used
Apr 15, 2025 pm 10:03 PM
vscode terminal command cannot be used
Apr 15, 2025 pm 10:03 PM
Causes and solutions for the VS Code terminal commands not available: The necessary tools are not installed (Windows: WSL; macOS: Xcode command line tools) Path configuration is wrong (add executable files to PATH environment variables) Permission issues (run VS Code as administrator) Firewall or proxy restrictions (check settings, unrestrictions) Terminal settings are incorrect (enable use of external terminals) VS Code installation is corrupt (reinstall or update) Terminal configuration is incompatible (try different terminal types or commands) Specific environment variables are missing (set necessary environment variables)
 How to run sublime after writing the code
Apr 16, 2025 am 08:51 AM
How to run sublime after writing the code
Apr 16, 2025 am 08:51 AM
There are six ways to run code in Sublime: through hotkeys, menus, build systems, command lines, set default build systems, and custom build commands, and run individual files/projects by right-clicking on projects/files. The build system availability depends on the installation of Sublime Text.
