

A brief analysis of LLM observability

Hello everyone, my name is Luga. Today we continue to explore a technology-related topic in the artificial intelligence ecosystem - the observability of LLM (Large Language Model). This article will continue to analyze the observability of LLM in depth to help everyone understand its importance and core ecosystem knowledge.

1. Why does LLM need observability?
In today’s digitally connected world, large language models (LLM) are like a super Magicians with powerful abilities can quickly generate text, translate languages, create music, write poetry, program, etc., which brings great convenience to people's lives. However, due to the complexity of LLM, its management and use also face some challenges.
LLM usually contains hundreds of millions or even billions of parameters, and the interactions between these parameters are very complex. Therefore, it is not easy to accurately predict the output of LLM. In addition, the training data used by LLM usually comes from the real world, which may contain bias or erroneous information. These biases and errors can cause LLM to generate text with errors or biases.
Therefore, LLM Observability (Large Language Model Observability) is the key to solving the above challenges. It can help users understand the running status, performance and security of LLM. Specifically, observability provides the following information: LLM's real-time operating data, resource utilization, request response time, error rate, logging, etc. This information can help users discover and solve problems in a timely manner, optimize the performance of LLM, and ensure its safe operation. By providing comprehensive observability, LLM Observability enables users to better understand and manage LLM operations.
- Output results of LLM
- Parameter changes of LLM
- Resource usage of LLM
- Security risks of LLM
Based on the above related information, users can effectively manage and use LLM to ensure that LLM can operate safely, stably and efficiently.
2. Analysis of the five pillars of LLM observability
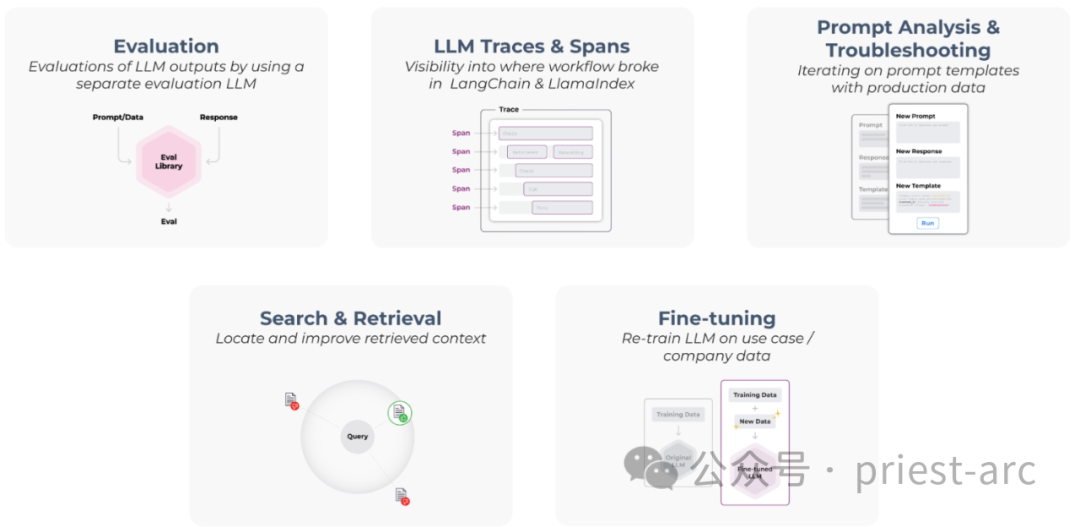
Figure: The five pillars of LLM observability
Generally speaking, LLM (Large model) The five pillars of observability mainly include the following:
1. Evaluation - Evaluation
"Evaluation" is an important pillar of LLM observability, used to understand and verify LLM model performance and capture potential hallucinations or issues such as question-answering questions. Evaluating the performance of LLMs is critical to ensuring the quality and reliability of the model. We can conduct plausibility assessment through common evaluation methods and techniques such as test data sets, A/B testing, metrics and evaluation criteria, user feedback and subjective evaluation, and model interpretive evaluation. These evaluation methods can help us understand the accuracy, robustness, generalization ability and interpretability of the model, as well as the model's performance in different tasks and scenarios. Through continuous evaluation and improvement, we can improve the performance and effectiveness of LLM models to better meet user needs.
By evaluating the performance of LLM, we can discover its potential problems and room for improvement. These evaluation results can guide subsequent optimization and improvement efforts to improve the quality and reliability of LLM.
In actual scenarios, it should be noted that LLM evaluation is a continuous iterative process. As the model is used and the environment changes, it may need to be evaluated and updated regularly. This ensures that LLM maintains high performance and accuracy under changing conditions.
2. LLM Traces and Spans: LLM Traces and Spans
The unique feature of LLM applications is their ability to capture spans and spans from common LLM application frameworks such as LangChain and LlamaIndex tracking information. These frameworks provide powerful tools and capabilities to help developers effectively monitor and document the span and execution paths of LLM applications.
By using these common LLM application frameworks, developers can take advantage of the span and trace capabilities they provide to gain insights into the behavior and performance of LLM applications. This helps monitor and optimize the operation of LLM applications and provides valuable insights that can be used to improve and enhance the performance and reliability of LLM.
3. Prompt Analysis and Troubleshooting - Prompt analysis and fault location
In order to track LLM performance problems, we can use Evals or traditional indicators as indicators to measure performance. These metrics can help us evaluate critical aspects such as accuracy, response time, resource utilization, etc. of LLM. By monitoring these metrics, we can quickly identify potential performance issues and take appropriate steps to improve them.
In addition, in order to accurately reproduce the problem, I think we can use real-time production data. By using data from actual production environments, we can simulate LLM runs under real-world scenarios and perform specific operations repeatedly to accurately reproduce performance issues. Such reproductions can help us better understand the root cause of the problem and implement appropriate solutions to resolve it.
4. Search and Retrieval - Search and Retrieval
Normally, we can add our proprietary data to LLM by using RAG (Retrieval-Augmented Generation). RAG is a powerful model architecture that combines retrieval and generation capabilities to combine our proprietary data with LLM. This combination enables LLM to leverage our proprietary data for more accurate and targeted inference and generation.
However, in order to ensure that the performance of LLM is optimized to the greatest extent, it is crucial to troubleshoot and evaluate the RAG. Troubleshooting RAG allows us to identify and resolve issues that may cause LLM performance degradation or error generation. At the same time, evaluating RAG can help us understand its performance on specific tasks or data sets and thus select the most suitable configuration and parameter settings.
Therefore, troubleshooting and evaluating RAG are critical steps to ensure LLM performance is optimized. After all, it helps us ensure smooth integration of LLM with our proprietary data, thereby improving the quality and reliability of LLM.
5. Fine-Tunig - Fine-tuning
The generalization ability of the model depends on the quality and quantity of the training data it receives. Therefore, large amounts of real or artificially generated data need to be collected and divided into data examples or problem clusters.
A data example can be a single data point or a combination of multiple data points. Issue clusters can be clusters based on specific issue types or domains. The format of the data points needs to be consistent with the requirements of the fine-tuning workflow.
3. Analysis of the core elements of LLM observability
Generally speaking, the core elements of LLM (large model) observability involve performance tracking, in-depth understanding, reliability guarantee, accuracy, etc. levels, specifically as follows:
1. Performance tracking
Observability is the cornerstone of LLM (Large Model Language), and the most critical component is consistent "performance tracking" . This process involves collecting key metrics related to LLM capabilities, such as accuracy predictions, response times, error types and biases, etc. These metrics not only help us identify and resolve performance issues, but also provide insights into LLM operational status and potential issues.
In actual performance tracking scenarios, we can use a variety of techniques. Generally speaking, metrics such as accuracy, precision, and recall remain popular choices. Accuracy measures the proportion of correct predictions, precision measures the relevance of those predictions, and recall measures the number of relevant results captured by the model. Of course, in addition to the above, we can also use other metrics, such as latency, throughput, resource usage, and security.
In actual business scenarios, "logging" is another core method of performance tracking. It provides detailed logs about model behavior, including inputs, outputs, errors, and other anomalies. These details help diagnose LLM problems such as bias, discrimination, and other security issues.
2. In-depth understanding
In addition to the above-mentioned performance tracking, an in-depth understanding of LLM (Large Model Language) is also a key element of observability. This requires careful examination of the training data, articulation of the decision-making algorithm, identification of any limitations, and a solid understanding of the model's limitations.
(1)Training data
Understanding the distribution of training data is crucial because biases in the data may translate into biases in the model. For example, if the training dataset contains mostly male voices, the model may be more sensitive to male voices, resulting in a bias against female voices.
In addition to bias, noise and inconsistencies in training data may also affect model performance. Therefore, before using training data, we need to carefully check the quality and reliability of the data.
(2) Decision-making algorithm
Analysis of the decision-making mechanism can help identify possible biases or inaccuracies in the model. For example, if a model behaves abnormally when processing a specific type of input, this may indicate a flaw in the decision-making algorithm. Therefore, by understanding the decision-making mechanisms, we can more easily identify and correct potential problems with the model.
(3)Limitations
Recognizing the limitations of LLM is invaluable. Although these models are advanced, they are not perfect. They may exhibit biases, generate errors, and be susceptible to certain unusual inputs.
For example, LLMs may produce biased results because they are trained on datasets that contain biases. Additionally, LLMs can generate errors because they are based on probabilistic models and therefore have a certain degree of uncertainty. Finally, LLM may be affected by certain anomalous inputs, such as inputs containing errors or malicious content.
3. Reliability Guarantee
Ensuring the reliability of LLM is another core element of observability. A reliable LLM is able to operate stably under a variety of input scenarios without crashing or producing erroneous output even under harsh or abnormal conditions.
The most common strategy is stress testing, as a common method to verify the reliability of the LLM, by providing the LLM with various inputs, including inputs designed to challenge the model to push it to its limits. A reliable LLM will be able to handle these inputs without crashing or producing erroneous output.
Fault tolerance is another common strategy to ensure LLM reliability. The fault-tolerant design allows LLM to continue operating when certain components fail. For example, if a layer of the LLM fails, the fault-tolerant model should still be able to generate accurate predictions.
4. Accuracy
The last key goal of LLM observability is to improve the "accuracy" of the model, which requires identifying and mitigating biases and errors. Bias and errors are two key factors that affect model accuracy.
Deviation usually refers to the difference between the model prediction results and the real situation. Bias may come from factors such as data set, model design, or training process. Bias can cause a model to produce unfair or inaccurate results.
Error usually means that the model prediction results are inconsistent with the real situation. Errors can come from randomness in the model, noise, or other factors. Errors can cause models to produce inaccurate results.
Deviation detection and error detection are two common techniques for identifying and mitigating deviations and errors. Bias detection identifies systematic deviations in model predictions, while error detection identifies any inaccuracies in model output.
Once deviations and errors are identified, we can correct them through various measures. In actual business scenarios, corrective measures mainly include the following:
- Data cleaning: remove deviations in the data set.
- Model design: Improve model design and reduce deviations.
- Model training: Use a more representative data set or more advanced training methods to train the model.
Commonly used error correction measures mainly involve the following levels:
- Retrain the model: Use a more accurate data set or more advanced training methods to retrain the model .
- Fine-tune model parameters: Adjust model parameters to reduce errors.
- Use post-processing techniques: Post-process the model output to improve accuracy.
Thus, through the above, LLM observability can help improve the reliability and observability of LLM only by carefully tracking performance design, enhancing understanding of LLM, optimizing accuracy, and ensuring reliability. reliability.
In summary, when using LLM, ensuring its observability is a key practice that helps ensure the reliability and trustworthiness of using LLM. By monitoring the performance metrics and behavior of LLMs, gaining insights into their inner workings, and ensuring the accuracy and reliability of LLMs, organizations can effectively reduce the risks associated with these powerful AI models.
Reference: [1] https://docs.arize.com/arize/what-is-llm-observability
The above is the detailed content of A brief analysis of LLM observability. For more information, please follow other related articles on the PHP Chinese website!

Hot AI Tools

Undresser.AI Undress
AI-powered app for creating realistic nude photos

AI Clothes Remover
Online AI tool for removing clothes from photos.

Undress AI Tool
Undress images for free

Clothoff.io
AI clothes remover

Video Face Swap
Swap faces in any video effortlessly with our completely free AI face swap tool!

Hot Article
Hot Tools

Notepad++7.3.1
Easy-to-use and free code editor

SublimeText3 Chinese version
Chinese version, very easy to use

Zend Studio 13.0.1
Powerful PHP integrated development environment

Dreamweaver CS6
Visual web development tools

SublimeText3 Mac version
God-level code editing software (SublimeText3)
Hot Topics
 1669
1669
 14
1428
52
1329
25
1273
29
1256
24
14
1428
52
1329
25
1273
29
1256
24

 How to use the chrono library in C?
Apr 28, 2025 pm 10:18 PM
How to use the chrono library in C?
Apr 28, 2025 pm 10:18 PM
Using the chrono library in C can allow you to control time and time intervals more accurately. Let's explore the charm of this library. C's chrono library is part of the standard library, which provides a modern way to deal with time and time intervals. For programmers who have suffered from time.h and ctime, chrono is undoubtedly a boon. It not only improves the readability and maintainability of the code, but also provides higher accuracy and flexibility. Let's start with the basics. The chrono library mainly includes the following key components: std::chrono::system_clock: represents the system clock, used to obtain the current time. std::chron
 How to understand DMA operations in C?
Apr 28, 2025 pm 10:09 PM
How to understand DMA operations in C?
Apr 28, 2025 pm 10:09 PM
DMA in C refers to DirectMemoryAccess, a direct memory access technology, allowing hardware devices to directly transmit data to memory without CPU intervention. 1) DMA operation is highly dependent on hardware devices and drivers, and the implementation method varies from system to system. 2) Direct access to memory may bring security risks, and the correctness and security of the code must be ensured. 3) DMA can improve performance, but improper use may lead to degradation of system performance. Through practice and learning, we can master the skills of using DMA and maximize its effectiveness in scenarios such as high-speed data transmission and real-time signal processing.
 What is real-time operating system programming in C?
Apr 28, 2025 pm 10:15 PM
What is real-time operating system programming in C?
Apr 28, 2025 pm 10:15 PM
C performs well in real-time operating system (RTOS) programming, providing efficient execution efficiency and precise time management. 1) C Meet the needs of RTOS through direct operation of hardware resources and efficient memory management. 2) Using object-oriented features, C can design a flexible task scheduling system. 3) C supports efficient interrupt processing, but dynamic memory allocation and exception processing must be avoided to ensure real-time. 4) Template programming and inline functions help in performance optimization. 5) In practical applications, C can be used to implement an efficient logging system.
 Steps to add and delete fields to MySQL tables
Apr 29, 2025 pm 04:15 PM
Steps to add and delete fields to MySQL tables
Apr 29, 2025 pm 04:15 PM
In MySQL, add fields using ALTERTABLEtable_nameADDCOLUMNnew_columnVARCHAR(255)AFTERexisting_column, delete fields using ALTERTABLEtable_nameDROPCOLUMNcolumn_to_drop. When adding fields, you need to specify a location to optimize query performance and data structure; before deleting fields, you need to confirm that the operation is irreversible; modifying table structure using online DDL, backup data, test environment, and low-load time periods is performance optimization and best practice.
 How to measure thread performance in C?
Apr 28, 2025 pm 10:21 PM
How to measure thread performance in C?
Apr 28, 2025 pm 10:21 PM
Measuring thread performance in C can use the timing tools, performance analysis tools, and custom timers in the standard library. 1. Use the library to measure execution time. 2. Use gprof for performance analysis. The steps include adding the -pg option during compilation, running the program to generate a gmon.out file, and generating a performance report. 3. Use Valgrind's Callgrind module to perform more detailed analysis. The steps include running the program to generate the callgrind.out file and viewing the results using kcachegrind. 4. Custom timers can flexibly measure the execution time of a specific code segment. These methods help to fully understand thread performance and optimize code.
 Top 10 digital currency trading platforms: Top 10 safe and reliable digital currency exchanges
Apr 30, 2025 pm 04:30 PM
Top 10 digital currency trading platforms: Top 10 safe and reliable digital currency exchanges
Apr 30, 2025 pm 04:30 PM
The top 10 digital virtual currency trading platforms are: 1. Binance, 2. OKX, 3. Coinbase, 4. Kraken, 5. Huobi Global, 6. Bitfinex, 7. KuCoin, 8. Gemini, 9. Bitstamp, 10. Bittrex. These platforms all provide high security and a variety of trading options, suitable for different user needs.
 Quantitative Exchange Ranking 2025 Top 10 Recommendations for Digital Currency Quantitative Trading APPs
Apr 30, 2025 pm 07:24 PM
Quantitative Exchange Ranking 2025 Top 10 Recommendations for Digital Currency Quantitative Trading APPs
Apr 30, 2025 pm 07:24 PM
The built-in quantization tools on the exchange include: 1. Binance: Provides Binance Futures quantitative module, low handling fees, and supports AI-assisted transactions. 2. OKX (Ouyi): Supports multi-account management and intelligent order routing, and provides institutional-level risk control. The independent quantitative strategy platforms include: 3. 3Commas: drag-and-drop strategy generator, suitable for multi-platform hedging arbitrage. 4. Quadency: Professional-level algorithm strategy library, supporting customized risk thresholds. 5. Pionex: Built-in 16 preset strategy, low transaction fee. Vertical domain tools include: 6. Cryptohopper: cloud-based quantitative platform, supporting 150 technical indicators. 7. Bitsgap:
 How does deepseek official website achieve the effect of penetrating mouse scroll event?
Apr 30, 2025 pm 03:21 PM
How does deepseek official website achieve the effect of penetrating mouse scroll event?
Apr 30, 2025 pm 03:21 PM
How to achieve the effect of mouse scrolling event penetration? When we browse the web, we often encounter some special interaction designs. For example, on deepseek official website, �...
