

How to debug HTML pages using Google Chrome?

Some friends want to know how to debug html pages in Google Chrome. Here I will give you a detailed introduction to the operation of debugging html interface in Google Chrome. If you are interested, come and take a look.
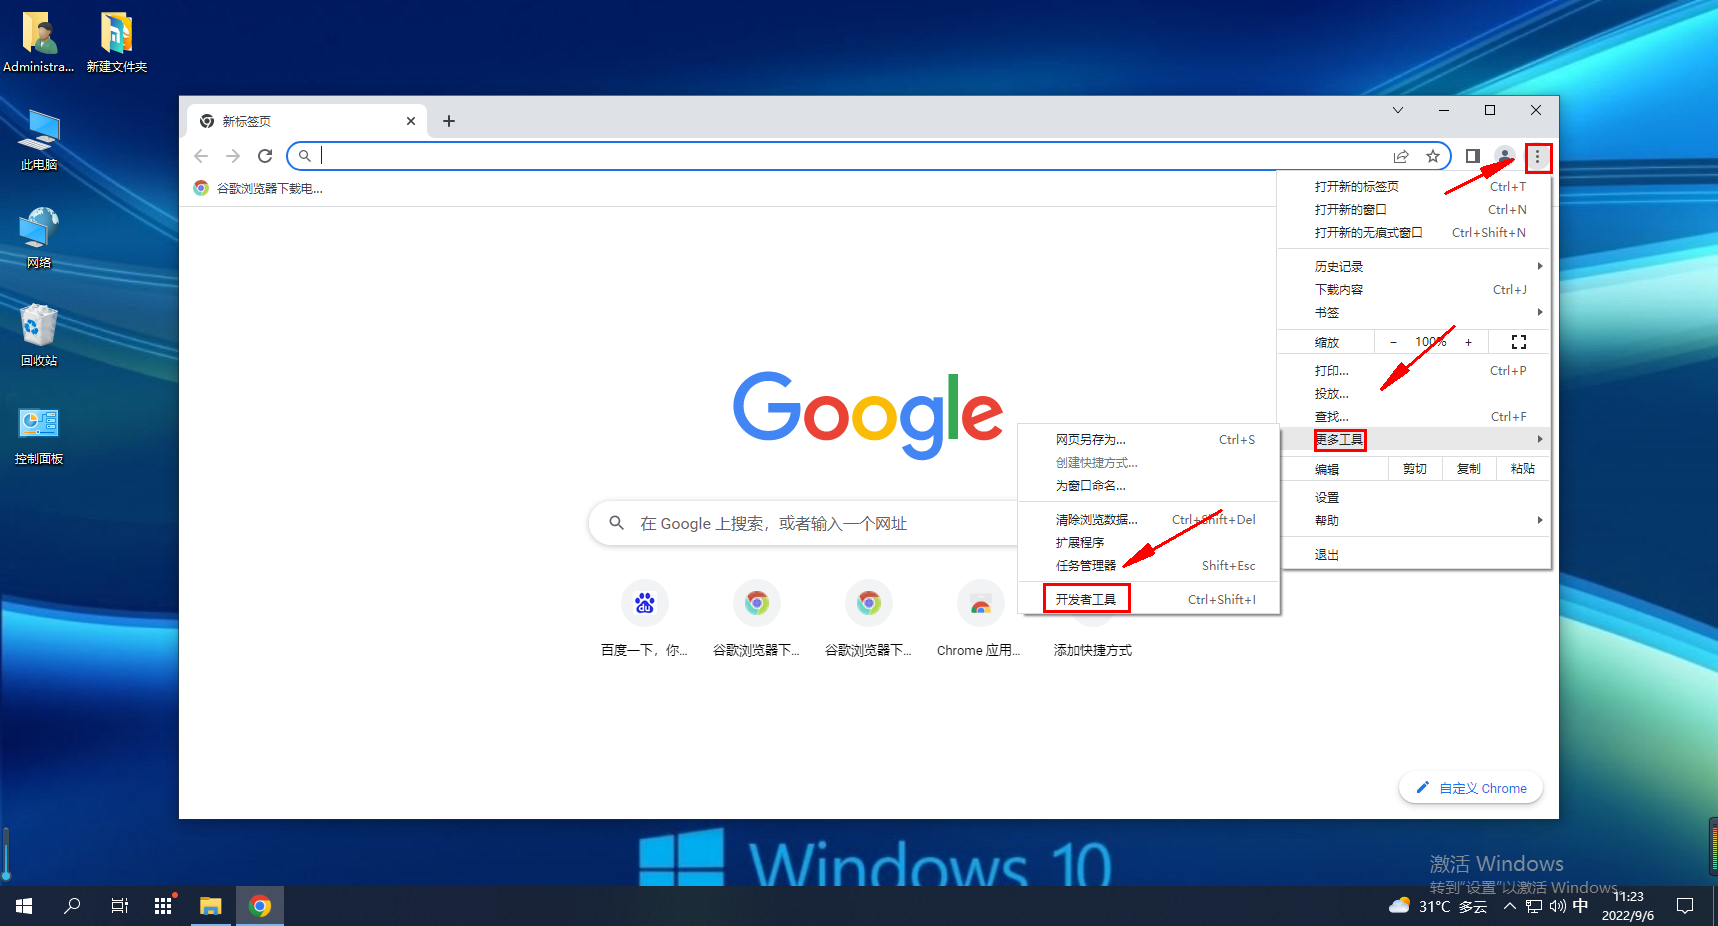
1. Enter the software, click the "Menu" button in the upper right corner of the page, and select "Developer Tools" from the "More Tools" option in the drop-down option list.
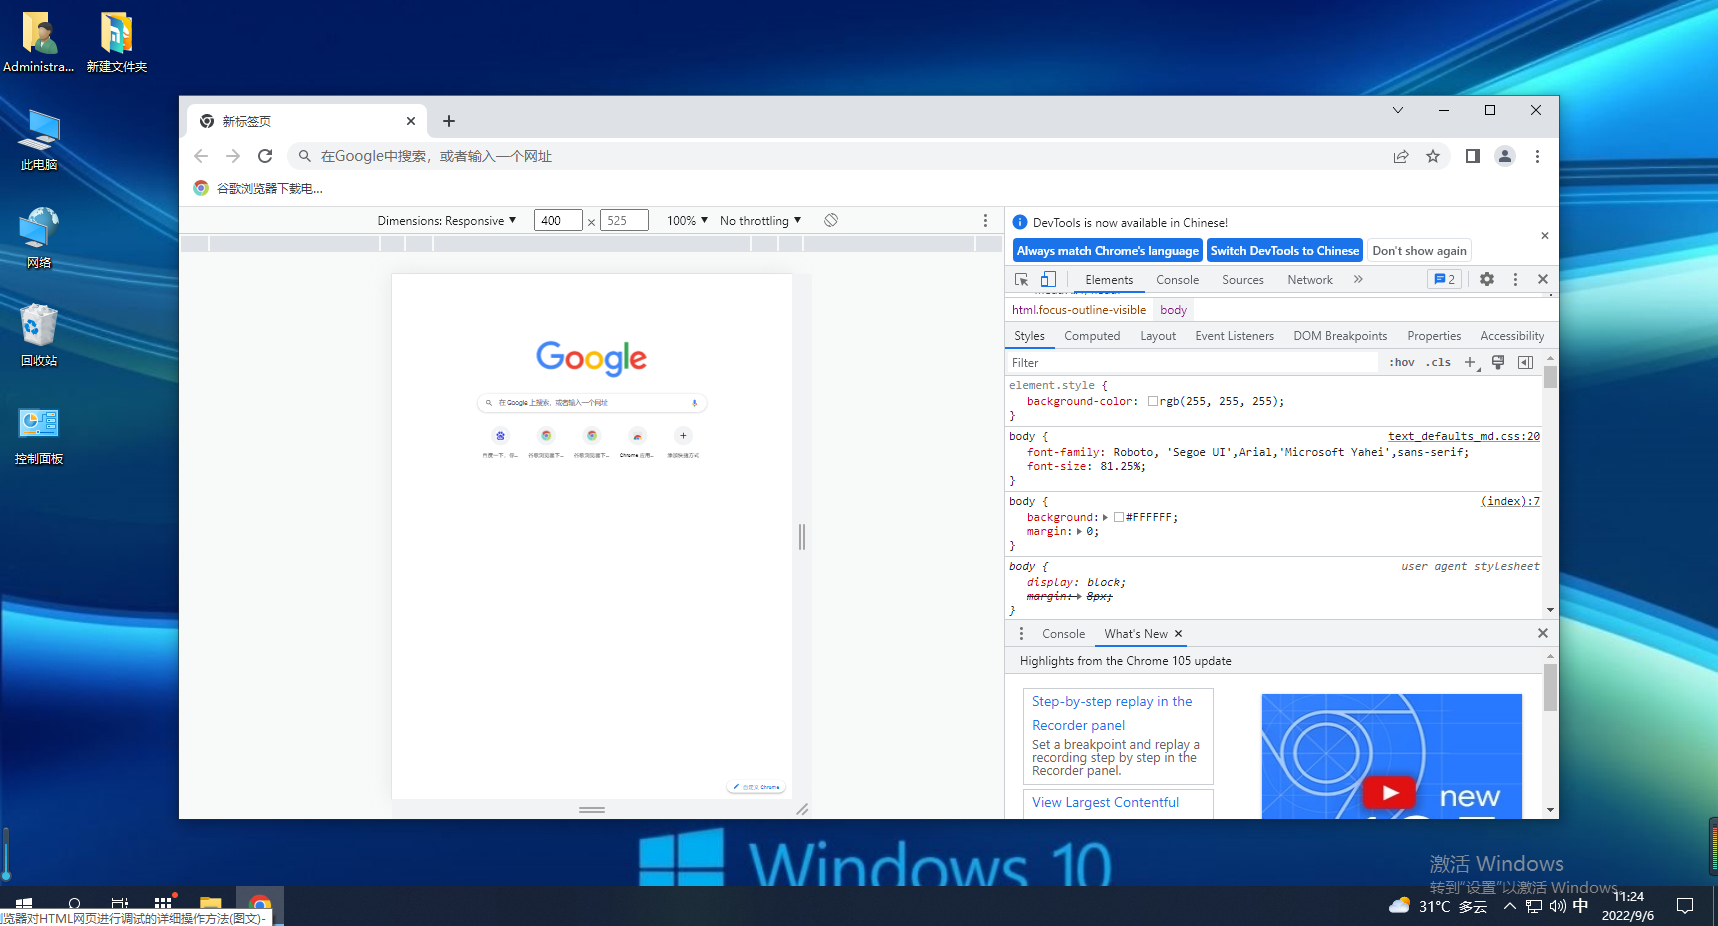
2. Then the developer tools will pop up, and you can view the elements on the editing page, including HTML and CSS.
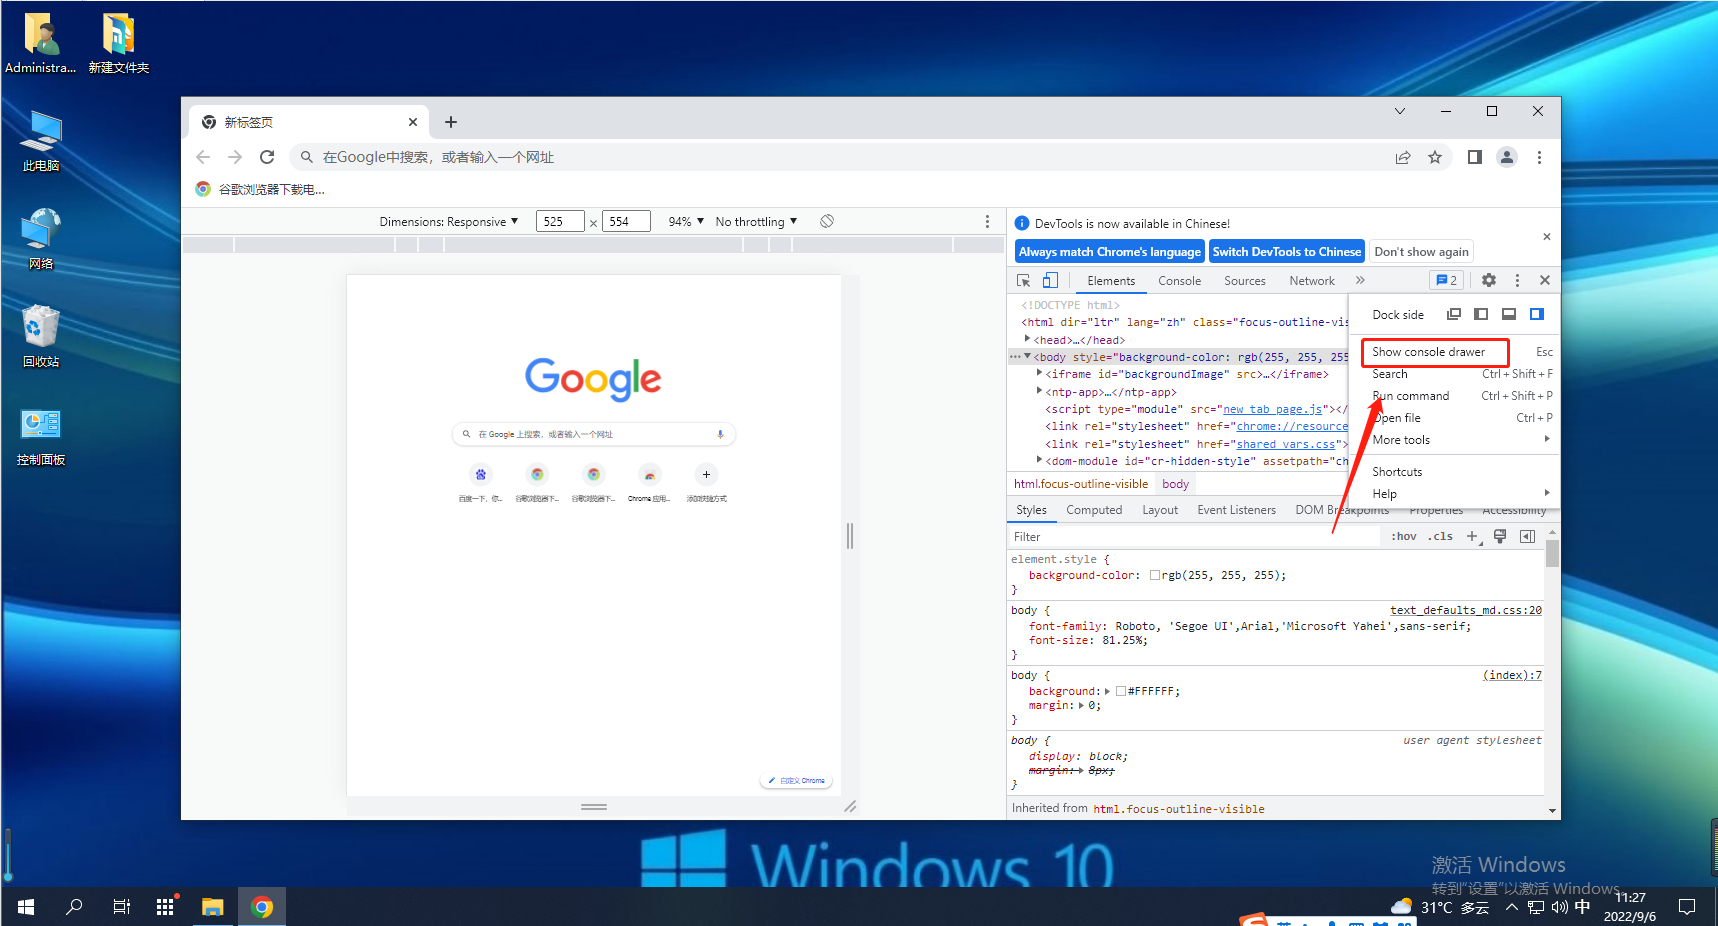
3. We can click on the label to edit it.
The above is the detailed content of How to debug HTML pages using Google Chrome?. For more information, please follow other related articles on the PHP Chinese website!

Hot AI Tools

Undresser.AI Undress
AI-powered app for creating realistic nude photos

AI Clothes Remover
Online AI tool for removing clothes from photos.

Undress AI Tool
Undress images for free

Clothoff.io
AI clothes remover

Video Face Swap
Swap faces in any video effortlessly with our completely free AI face swap tool!

Hot Article
Hot Tools

Notepad++7.3.1
Easy-to-use and free code editor

SublimeText3 Chinese version
Chinese version, very easy to use

Zend Studio 13.0.1
Powerful PHP integrated development environment

Dreamweaver CS6
Visual web development tools

SublimeText3 Mac version
God-level code editing software (SublimeText3)
Hot Topics
 1666
1666
 14
1426
52
1328
25
1273
29
1255
24
14
1426
52
1328
25
1273
29
1255
24