

How to use JS and Amap to implement the location heat map function


How to use JS and Amap to implement the location heat map function
With the popularity of the Internet and mobile devices, people’s demand for geographical location information is getting higher and higher. . Location heat maps can visually display the heat distribution of various locations in a certain area, helping us better understand data and trends. This article will introduce how to use JS and Amap to implement the location heat map function, and provide specific code examples.
1. Preparation
Before implementation, we need to complete the following preparations:
- Register an AutoNavi open platform account and apply for relevant API
- Introduce the JS file of Amap API
- Prepare the location data you need
2. Code implementation
The following are the specific code implementation steps:
-
Create a div element that holds the map
<div id="map" style="width: 100%; height: 600px;"></div>
Copy after login Introduce the JS file of the Amap map
<script src="https://webapi.amap.com/maps?v=1.4.15&key=你的API Key"></script>
Copy after loginPlease change the "your Replace "API Key" with the API Key you applied for on the Amap Open Platform.
Initialize the map
<script>
 var map = new AMap.Map('map', {
     zoom:12,
     center: [116.397428, 39.90923],
     resizeEnable: true
 });
</script>
Copy after loginReplace [116.397428, 39.90923] in the above code with the coordinates of the initial center point of the map you need, and adjust the zoom of the map as needed level.
Introducing the heat map plug-in
<script src="https://webapi.amap.com/loca?v=1.3.0&plugin=AMap.Heatmap"></script>
Copy after loginCreating a heat map layer
<script>
 var heatmap;
 map.plugin(["AMap.Heatmap"], function() {
     heatmap = new AMap.Heatmap(map, {
         radius: 25,
         opacity: [0, 0.8]
     });
 });
</script>
Copy after loginThe radius and radius of the heat map can be adjusted as needed transparency.
Load and display heat map data
Suppose your location data is stored in an array, and each element contains the longitude, latitude and heat value of the location. We can load the data in the array onto the heat map layer through the following code:<script> var heatmapData = [ {lng: 116.418261, lat: 39.921984, count: 10}, {lng: 116.417516, lat: 39.921499, count: 11}, // 其他地点数据... ]; heatmap.setDataSet({ data: heatmapData, max: 100 }); </script>Copy after loginPlease make corresponding modifications based on your own location data.
3. Summary and Outlook
This article introduces how to use JS and Amap to implement the location heat map function, and provides specific code examples. By using the API and plug-ins provided by Amap, we can easily display the heat distribution of geographical locations on the web page. In practice, we can further combine other technologies and functions, such as data visualization, search, etc., to meet different needs. I hope this article was helpful to you, and I wish you success in implementing location heatmap functionality!
The above is the detailed content of How to use JS and Amap to implement the location heat map function. For more information, please follow other related articles on the PHP Chinese website!

Hot AI Tools

Undresser.AI Undress
AI-powered app for creating realistic nude photos

AI Clothes Remover
Online AI tool for removing clothes from photos.

Undress AI Tool
Undress images for free

Clothoff.io
AI clothes remover

Video Face Swap
Swap faces in any video effortlessly with our completely free AI face swap tool!

Hot Article
Hot Tools

Notepad++7.3.1
Easy-to-use and free code editor

SublimeText3 Chinese version
Chinese version, very easy to use

Zend Studio 13.0.1
Powerful PHP integrated development environment

Dreamweaver CS6
Visual web development tools

SublimeText3 Mac version
God-level code editing software (SublimeText3)
Hot Topics


 How to register for Amap
Apr 08, 2024 pm 04:39 PM
How to register for Amap
Apr 08, 2024 pm 04:39 PM
1. First install and open the Amap app on your mobile phone, click [My] and select [Login/Register]. 2. Select a mobile phone number, WeChat or Alipay to register as needed, and fill in personal information according to the prompts, including mobile phone number, password, etc. 3. After completing the filling, click [Register] to complete the account registration. 4. Afterwards, use the method selected during registration for login verification. If you register through a mobile phone number, you need to enter your mobile phone number and password to log in.
 Does Amap require mobile phone registration?
May 05, 2024 pm 05:12 PM
Does Amap require mobile phone registration?
May 05, 2024 pm 05:12 PM
Yes, for security, personalized services and account management, Amap requires registration with a mobile phone number. The registration steps include: Open the Amap app, click "My" and "Login/Register", select a mobile phone number to register, enter the mobile phone number to get the verification code, set a password to complete the registration.
 Why is there no sound in the Amap navigation?
Apr 02, 2024 am 05:09 AM
Why is there no sound in the Amap navigation?
Apr 02, 2024 am 05:09 AM
The reasons why there is no sound in Amap navigation include improper speaker connection, lowering the device volume, incorrect Amap settings, background application interference, mobile phone silent or vibration mode, and system permission issues. The solutions are as follows: check the speaker connection; adjust the volume; check the Amap map settings; close background applications; check the phone mode; grant permissions; restart the device; update the Amap map; and contact customer service.
 Operation steps for car invoicing on Amap
Apr 01, 2024 pm 10:10 PM
Operation steps for car invoicing on Amap
Apr 01, 2024 pm 10:10 PM
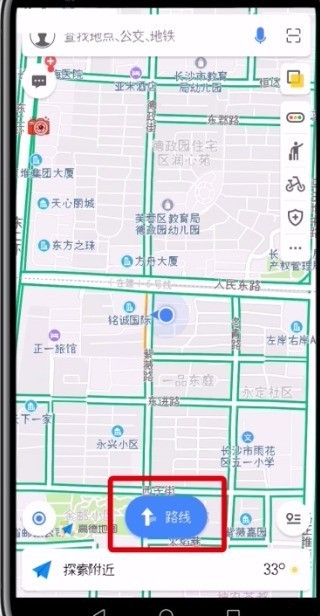
1. First open the Amap and click [Route]. 2. Click [Call a Car] and click [Personal Center] on the left. 3. Click [Invoice]. 4. Check the itinerary and click [Invoice].
 Xiaomi CarWith joins hands with Amap to open a new era of lane-level navigation
Apr 16, 2024 pm 08:34 PM
Xiaomi CarWith joins hands with Amap to open a new era of lane-level navigation
Apr 16, 2024 pm 08:34 PM
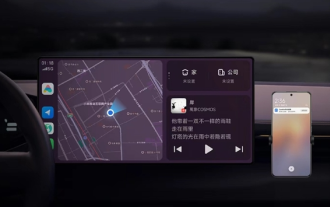
According to news on April 16, Xiaomi users have recently welcomed a practical new feature - Xiaomi CarWith has officially launched Amap lane navigation. The launch of this service will undoubtedly bring drivers a more accurate and convenient navigation experience. According to the data, the integration of Amap and CarWith has achieved seamless connection, and users can directly experience the precise guidance of lane-level navigation without the need for additional software updates. This improvement is likely to be made on the server side, saving users the tedious update step. Car lane-level navigation is an innovative feature of Amap. It can restore the real road layout to a high degree on the screen, clearly displaying the number of lanes, ground markings, entrances and exits, special lanes and other information on the current road, providing drivers with a more comprehensive ,
 How to view travel records on Amap
May 05, 2024 pm 05:21 PM
How to view travel records on Amap
May 05, 2024 pm 05:21 PM
Steps to view travel records on Amap: 1. Log in to Amap; 2. Enter "My" → "My Travel"; 3. View the list of travel records; 4. Click to view details; 5. Export records (optional) .
 How to use Amap to open family maps and share maps with family members. Methods and steps for sharing maps with family members.
May 04, 2024 pm 03:34 PM
How to use Amap to open family maps and share maps with family members. Methods and steps for sharing maps with family members.
May 04, 2024 pm 03:34 PM
Amap APP is a professional and easy-to-use free map navigation software. Everyone likes it very much. It has a variety of functions, which can bring great convenience to our lives. What? Inquiries about some locations, planning of routes, viewing some street view maps, or inquiries about longitude and latitude can be solved here. The operation is simple and convenient, beyond your imagination. Many times, everyone likes it. Sharing maps and location information here makes people feel more secure, which is very good. Many times, for some children or elderly people at home, it will make people more worried when they go out. , when encountering various situations, you can avoid the situation where everyone will get lost.
 How to use the pathfinding mode of Amap_How to use the pathfinding mode of Amap
Apr 01, 2024 pm 09:16 PM
How to use the pathfinding mode of Amap_How to use the pathfinding mode of Amap
Apr 01, 2024 pm 09:16 PM
1. Open Amap on your mobile phone. 2. Click [My] in the lower right corner of the home page. 3. Click the icon in the upper right corner of your personal homepage. 4. Continue to click [Navigation Settings]. 5. You can see [Automatically enter pathfinding mode] on this page. 6. Click Open to complete the operation.
