
 Backend Development
PHP Tutorial
What are the tips for using PHP performance optimization functions?
Backend Development
PHP Tutorial
What are the tips for using PHP performance optimization functions?
What are the tips for using PHP performance optimization functions?


What are the tips for using php performance optimization functions?
For websites or applications developed using PHP, performance optimization is very important. A high-performance website can provide a better user experience and also reduce the load on the server. In optimizing PHP performance, we need to pay attention to some specific functions and techniques. Below are some common tips for using PHP performance optimization functions.
- Use caching functions
Caching is very helpful for reducing database queries and improving page loading speed. There are many caching functions available in PHP, such as memcache and Redis. By storing results in the cache, you can avoid repeated database queries and increase the speed of data retrieval.
Sample code:
// 使用memcache进行缓存
$memcache = new Memcache;
$memcache->connect('localhost', 11211);
// 尝试从缓存中获取数据
$data = $memcache->get('cache_key');
if($data === false) {
  // 从数据库中获取数据
  $data = fetchDataFromDatabase();
  // 将数据存储到缓存中,缓存时间为1小时
  $memcache->set('cache_key', $data, MEMCACHE_COMPRESSED, 3600);
}
// 使用数据进行相应操作- Use the correct database function
In database operations, we need to choose the appropriate function to perform query operations. Some common database functions, such as mysql_query() and mysqli_query(), are not very efficient. You can try to use more efficient database functions such as PDO for database operations.
Sample code:
// 使用PDO进行数据库查询
$pdo = new PDO('mysql:host=localhost;dbname=database', 'username', 'password');
// 执行查询语句
$query = $pdo->query('SELECT * FROM table');
// 获取查询结果
$result = $query->fetchAll(PDO::FETCH_ASSOC);
// 使用查询结果进行操作- Use appropriate loop functions
In PHP, using appropriate loop functions can greatly improve the execution efficiency of the program. A foreach loop is generally more efficient than a for loop, especially when iterating over an array. In addition, the array_map() function and array_walk() function are also good choices, which can perform batch processing on arrays without explicitly using loops.
Sample code:
// 使用foreach遍历数组
foreach($array as $value) {
  // 对每个值进行相应操作
}

// 使用array_map函数对数组进行处理
$newArray = array_map(function($value) {
  // 对每个值进行相应处理
  return $value;
}, $array);- Avoid calling the same function multiple times
In PHP, avoiding multiple calls to the same function can improve the performance of the program effectiveness. You can avoid calling a function repeatedly by assigning the result returned by the function to a variable and using the variable later.
Sample code:
// 多次调用相同的函数
$result = doSomething();
// 使用$result进行相应操作
$result = doSomething();
// 再次使用$result进行相应操作

// 避免多次调用相同的函数
$result = doSomething();
// 使用$result进行相应操作
// 再次使用$result进行相应操作
In summary, optimizing PHP performance requires paying attention to some specific functions and techniques. By using caching functions, correct database functions, appropriate loop functions and avoiding calling the same function multiple times, we can improve the execution efficiency of PHP programs and improve the performance and user experience of the website.
The above is the detailed content of What are the tips for using PHP performance optimization functions?. For more information, please follow other related articles on the PHP Chinese website!

Hot AI Tools

Undresser.AI Undress
AI-powered app for creating realistic nude photos

AI Clothes Remover
Online AI tool for removing clothes from photos.

Undress AI Tool
Undress images for free

Clothoff.io
AI clothes remover

Video Face Swap
Swap faces in any video effortlessly with our completely free AI face swap tool!

Hot Article
Hot Tools

Notepad++7.3.1
Easy-to-use and free code editor

SublimeText3 Chinese version
Chinese version, very easy to use

Zend Studio 13.0.1
Powerful PHP integrated development environment

Dreamweaver CS6
Visual web development tools

SublimeText3 Mac version
God-level code editing software (SublimeText3)
Hot Topics
 1666
1666
 14
1426
52
1328
25
1273
29
1255
24
14
1426
52
1328
25
1273
29
1255
24

 Detailed explanation of C++ function debugging: How to debug problems in multi-threaded functions?
May 02, 2024 pm 04:15 PM
Detailed explanation of C++ function debugging: How to debug problems in multi-threaded functions?
May 02, 2024 pm 04:15 PM
C++ multi-thread debugging can use GDB: 1. Enable debugging information compilation; 2. Set breakpoints; 3. Use infothreads to view threads; 4. Use thread to switch threads; 5. Use next, stepi, and locals to debug. Actual case debugging deadlock: 1. Use threadapplyallbt to print the stack; 2. Check the thread status; 3. Single-step the main thread; 4. Use condition variables to coordinate access to solve the deadlock.
 How to use LeakSanitizer to debug C++ memory leaks?
Jun 02, 2024 pm 09:46 PM
How to use LeakSanitizer to debug C++ memory leaks?
Jun 02, 2024 pm 09:46 PM
How to use LeakSanitizer to debug C++ memory leaks? Install LeakSanitizer. Enable LeakSanitizer via compile flag. Run the application and analyze the LeakSanitizer report. Identify memory allocation types and allocation locations. Fix memory leaks and ensure all dynamically allocated memory is released.
 7-zip maximum compression rate setting, how to compress 7zip to the minimum
Jun 18, 2024 pm 06:12 PM
7-zip maximum compression rate setting, how to compress 7zip to the minimum
Jun 18, 2024 pm 06:12 PM
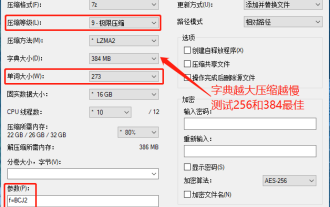
I found that the compressed package downloaded from a download website will be larger than the original compressed package after decompression. The difference is tens of Kb for a small one and several dozen Mb for a large one. If it is uploaded to a cloud disk or paid space, it does not matter if the file is small. , if there are many files, the storage cost will be greatly increased. I studied it specifically and can learn from it if necessary. Compression level: 9-Extreme compression Dictionary size: 256 or 384, the more compressed the dictionary, the slower it is. The compression rate difference is larger before 256MB, and there is no difference in compression rate after 384MB. Word size: maximum 273 Parameters: f=BCJ2, test and add parameter compression rate will be higher
 How to do efficient debugging in Java lambda expressions?
Apr 24, 2024 pm 12:03 PM
How to do efficient debugging in Java lambda expressions?
Apr 24, 2024 pm 12:03 PM
Efficiently debug Lambda expressions: IntelliJ IDEA Debugger: Set breakpoints on variable declarations or methods, inspect internal variables and state, and see the actual implementation class. Java9+JVMTI: Connect to the runtime JVM to obtain identifiers, inspect bytecode, set breakpoints, and monitor variables and status during execution.
 How to conduct concurrency testing and debugging in Java concurrent programming?
May 09, 2024 am 09:33 AM
How to conduct concurrency testing and debugging in Java concurrent programming?
May 09, 2024 am 09:33 AM
Concurrency testing and debugging Concurrency testing and debugging in Java concurrent programming are crucial and the following techniques are available: Concurrency testing: Unit testing: Isolate and test a single concurrent task. Integration testing: testing the interaction between multiple concurrent tasks. Load testing: Evaluate an application's performance and scalability under heavy load. Concurrency Debugging: Breakpoints: Pause thread execution and inspect variables or execute code. Logging: Record thread events and status. Stack trace: Identify the source of the exception. Visualization tools: Monitor thread activity and resource usage.
 Shortcut to golang function debugging and analysis
May 06, 2024 pm 10:42 PM
Shortcut to golang function debugging and analysis
May 06, 2024 pm 10:42 PM
This article introduces shortcuts for Go function debugging and analysis, including: built-in debugger dlv, which is used to pause execution, check variables, and set breakpoints. Logging, use the log package to record messages and view them during debugging. The performance analysis tool pprof generates call graphs and analyzes performance, and uses gotoolpprof to analyze data. Practical case: Analyze memory leaks through pprof and generate a call graph to display the functions that cause leaks.
 How to debug PHP asynchronous code
May 31, 2024 am 09:08 AM
How to debug PHP asynchronous code
May 31, 2024 am 09:08 AM
Tools for debugging PHP asynchronous code include: Psalm: a static analysis tool that can find potential errors. ParallelLint: A tool that inspects asynchronous code and provides recommendations. Xdebug: An extension for debugging PHP applications by enabling a session and stepping through the code. Other tips include using logging, assertions, running code locally, and writing unit tests.
 What are the debugging techniques for recursive calls in Java functions?
May 05, 2024 am 10:48 AM
What are the debugging techniques for recursive calls in Java functions?
May 05, 2024 am 10:48 AM
The following techniques are available for debugging recursive functions: Check the stack traceSet debug pointsCheck if the base case is implemented correctlyCount the number of recursive callsVisualize the recursive stack
