

Interviewer: If you encounter OOM online, how to solve it?
OOM can be said to be one of the most feared problems for our developers. The causes are basically caused by code or JVM parameter configuration.
This article talks to readers about how to troubleshoot after the Java process triggers OOM.
It is often said to be in awe of the production environment, and solving problems quickly is also a sign of awe
Why Will OOM
OOM stands for "Out Of Memory", which means the memory is exhausted. When the JVM does not have enough memory to allocate space for the object, and the garbage collector has no space to recycle, it will throw this error
Why does OOM occur? It is generally caused by these problems
Too little allocation: The JVM initialization memory is small and the business uses a lot of memory; or the memory allocation in different JVM areas is unreasonable Code vulnerability: a certain object Frequently applied for but not released after no use, resulting in memory exhaustion
Memory leak: The memory used after application is not released, causing the virtual machine to be unable to be used again Using this memory, this memory is leaked. Because the applicant is no longer in use and cannot be allocated to others by the virtual machine
Memory overflow: The requested memory exceeds the memory size that the JVM can provide. This is called an overflow
Memory leaks persist and will eventually overflow. The two are causally related
Common OOM
The more common OOM types include the following
java.lang.OutOfMemoryError: PermGen space
Java7 permanent generation (method area) overflow, which is used Stores data such as class information, constants, static variables, and code compiled by the just-in-time compiler that have been loaded by the virtual machine. Whenever a class is loaded for the first time, metadata will be stored in the permanent generation
Generally appears in a large number of Class objects or JSP pages, or the use of CgLib dynamic proxy technology causes
We can pass -XX: PermSize and -XX: MaxPermSize Modify the size of the method area
Java8 changes the permanent generation to the metaspace, an error is reported: java.lang.OutOfMemoryError: Metadata space, the metaspace memory is insufficient and dynamically expanded by default
java.lang.StackOverflowError
Virtual machine stack overflow is usually caused by the existence of an infinite loop or deep recursive call in the program. If the stack size is set too small, overflow will occur. You can set the stack size through -Xss
The virtual machine throws a stack overflow error, and you can locate the wrong class and method in the log.
java.lang.OutOfMemoryError: Java heap space
Java heap memory overflow, the cause of overflow is generally due to unreasonable JVM heap memory settings or Memory leaks lead to
If there is a memory leak, you can use tools to view the reference chain from the leaked object to GC Roots. By mastering the type information of the leaked object and the GC Roots reference chain information, you can accurately locate the location of the leaked code
If there is no memory leak, that is, the objects in the memory must still be alive, then You should check the heap parameters of the virtual machine (-Xmx and -Xms) to see if the memory of the virtual machine can be increased.
Summary: The overflow scenario of the method area and the virtual machine stack will not be discussed too much in this article. The following mainly explains the common OOM troubleshooting ideas of Java heap space
Check the JVM memory distribution
Assume that our Java application The PID is 15162. Enter the command to view the JVM memory distribution jmap -heap 15162
[xxx@xxx ~]# jmap -heap 15162
Attaching to process ID 15162, please wait...
Debugger attached successfully.
Server compiler detected.
JVM version is 25.161-b12

using thread-local object allocation.
Mark Sweep Compact GC

Heap Configuration:
   MinHeapFreeRatio         = 40 # 最小堆使用比例
   MaxHeapFreeRatio         = 70 # 最大堆可用比例
   MaxHeapSize              = 482344960 (460.0MB) # 最大堆空间大小
   NewSize                  = 10485760 (10.0MB) # 新生代分配大小
   MaxNewSize               = 160759808 (153.3125MB) # 最大新生代可分配大小
   OldSize                  = 20971520 (20.0MB) # 老年代大小
   NewRatio                 = 2 # 新生代比例
   SurvivorRatio            = 8 # 新生代与 Survivor 比例
   MetaspaceSize            = 21807104 (20.796875MB) # 元空间大小
   CompressedClassSpaceSize = 1073741824 (1024.0MB) # Compressed Class Space 空间大小限制
   MaxMetaspaceSize         = 17592186044415 MB # 最大元空间大小
   G1HeapRegionSize         = 0 (0.0MB) # G1 单个 Region 大小

Heap Usage:  # 堆使用情况
New Generation (Eden + 1 Survivor Space): # 新生代
   capacity = 9502720 (9.0625MB) # 新生代总容量
   used     = 4995320 (4.763908386230469MB) # 新生代已使用
   free     = 4507400 (4.298591613769531MB) # 新生代剩余容量
   52.56726495150862% used # 新生代使用占比
Eden Space:
   capacity = 8454144 (8.0625MB) # Eden 区总容量
   used     = 4029752 (3.8430709838867188MB) # Eden 区已使用
   free     = 4424392 (4.219429016113281MB) # Eden 区剩余容量
   47.665996699370154% used  # Eden 区使用占比
From Space: # 其中一个 Survivor 区的内存分布
   capacity = 1048576 (1.0MB)
   used     = 965568 (0.92083740234375MB)
   free     = 83008 (0.07916259765625MB)
   92.083740234375% used
To Space: # 另一个 Survivor 区的内存分布
   capacity = 1048576 (1.0MB)
   used     = 0 (0.0MB)
   free     = 1048576 (1.0MB)
   0.0% used
tenured generation: # 老年代
   capacity = 20971520 (20.0MB)
   used     = 10611384 (10.119804382324219MB)
   free     = 10360136 (9.880195617675781MB)
   50.599021911621094% used

10730 interned Strings occupying 906232 bytes.
By viewing the JVM memory allocation and runtime usage, you can determine whether the memory allocation is reasonable
In addition, you can view the most resource-consuming objects while the JVM is running, jmap -histo:live 15162 | more
The JVM memory object list is sorted according to the memory size occupied by the object
instances: number of instances bytes: unit byte class name: class name
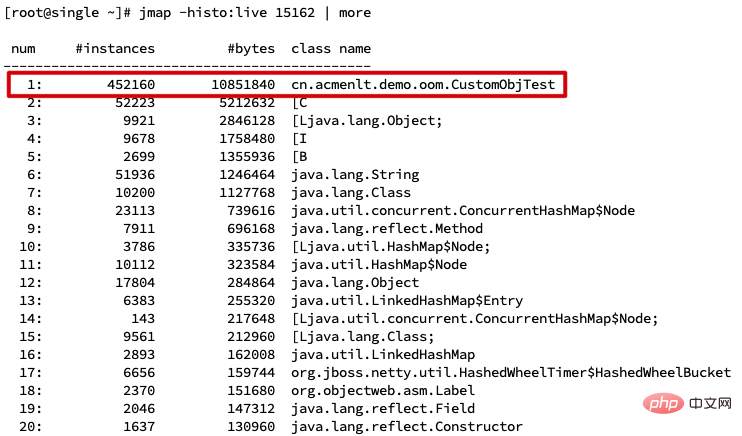
It is obvious that CustomObjTest object instances and excessive memory usage
Unfortunately, the solution has limitations. Because it can only troubleshoot the problem of excessive memory usage by objects
where "[" represents an array, for example, "[C" represents a Char array, and "[B" represents a Byte array. If the array memory takes up too much, we don’t know which objects hold it, so we need to Dump the memory for offline analysis
jmap -histo:liveExecute this command, the JVM will Trigger GC first, then collect statistics
Dump file analysis
The Dump file is the memory of the Java process Mirror, which mainly includes System information, Virtual machine properties, Complete thread Dump, Status of all classes and objects and other information
When a memory overflow or GC exception occurs in the program, it is suspected that the JVM has memory leak, then we can export the Dump file for analysis
Add the following to the JVM startup parameter configuration parameter
-XX:+HeapDumpOnOutOfMemoryError -XX:HeapDumpPath=./(参数为 Dump 文件生成路径)
当 JVM 发生 OOM 异常自动导出 Dump 文件,文件名称默认格式:
java_pid{pid}.hprof
上面配置是在应用抛出 OOM 后自动导出 Dump,或者可以在 JVM 运行时导出 Dump 文件
jmap -dump:file=[文件路径] [pid]

# 示例
jmap -dump:file=./jvmdump.hprof 15162
在本地写一个测试代码,验证下 OOM 以及分析 Dump 文件
设置 VM 参数:-Xms3m -Xmx3m -XX:+HeapDumpOnOutOfMemoryError -XX:HeapDumpPath=./
public static void main(String[] args) {
List<Object> oomList = Lists.newArrayList();
// 无限循环创建对象
while (true) {
oomList.add(new Object());
}
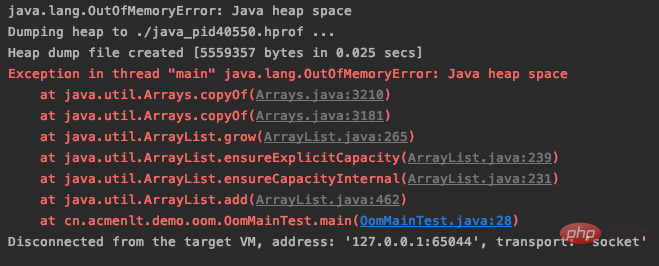
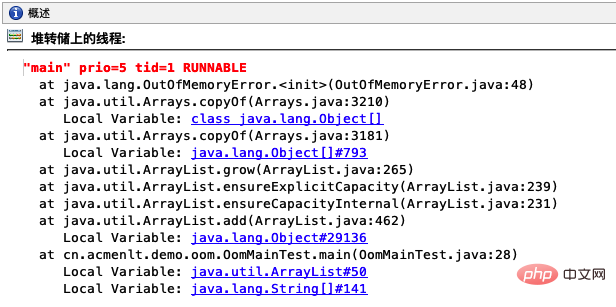
}通过报错信息得知,java heap space 表示 OOM 发生在堆区,并生成了 hprof 二进制文件在当前文件夹下
JvisualVM 分析
Dump 分析工具有很多,相对而言 JvisualVM、JProfiler、Eclipse Mat,使用人群更多一些。下面以 JvisualVM 举例分析 Dump 文件
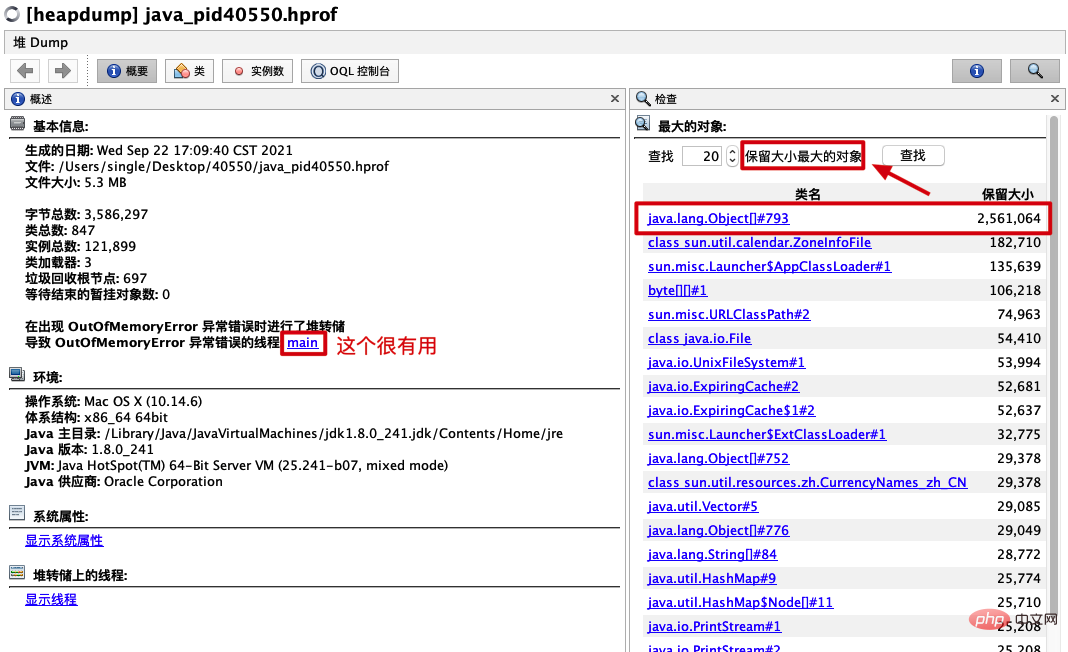
列举两个常用的功能,第一个是能看到触发 OOM 的线程堆栈,清晰得知程序溢出的原因
第二个就是可以查看 JVM 内存里保留大小最大的对象,可以自由选择排查个数
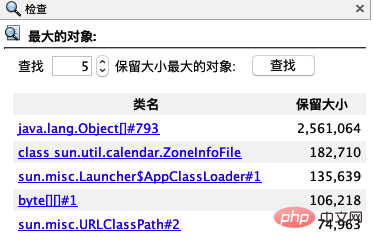
点击对象还可以跳转具体的对象引用详情页面
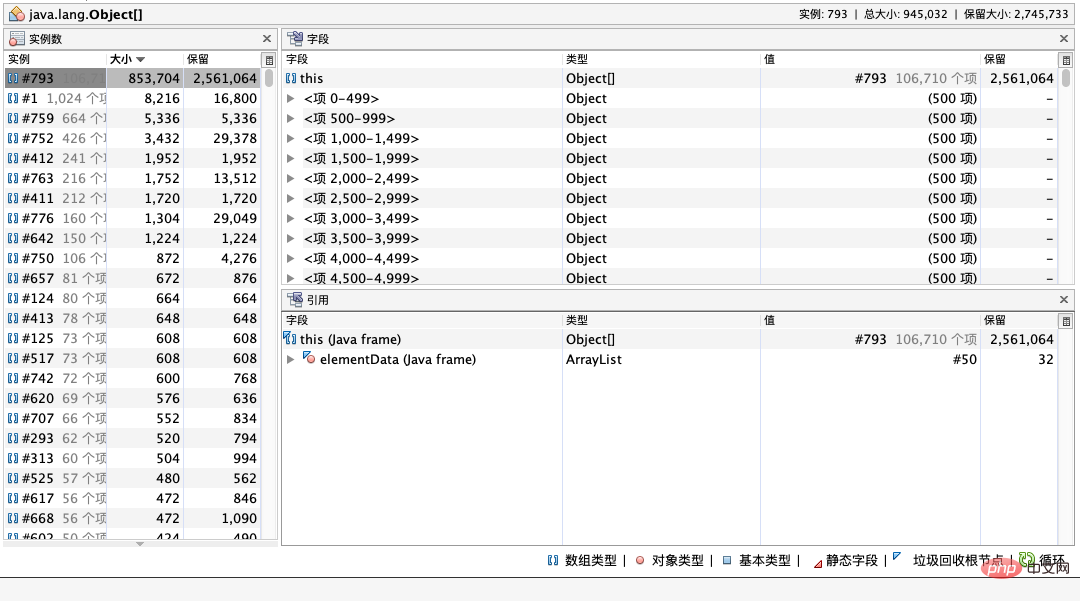
文中 Dump 文件较为简单,而正式环境出错的原因五花八门,所以不对该 Dump 文件做深度解析
注意:JvisualVM 如果分析大 Dump 文件,可能会因为内存不足打不开,需要调整默认的内存
Summary review
If you encounter JVM memory overflow online, you can troubleshoot in the following steps
jmap -heapCheck whether the memory allocation is too small##jmap -histo Check whether there is any obvious object allocation There are many and no releasesjmap -dump Export the JVM current memory snapshot, and use tools such as JDK or MAT to analyze the snapshot
The above is the detailed content of Interviewer: If you encounter OOM online, how to solve it?. For more information, please follow other related articles on the PHP Chinese website!

Hot AI Tools

Undresser.AI Undress
AI-powered app for creating realistic nude photos

AI Clothes Remover
Online AI tool for removing clothes from photos.

Undress AI Tool
Undress images for free

Clothoff.io
AI clothes remover

Video Face Swap
Swap faces in any video effortlessly with our completely free AI face swap tool!

Hot Article
Hot Tools

Notepad++7.3.1
Easy-to-use and free code editor

SublimeText3 Chinese version
Chinese version, very easy to use

Zend Studio 13.0.1
Powerful PHP integrated development environment

Dreamweaver CS6
Visual web development tools

SublimeText3 Mac version
God-level code editing software (SublimeText3)
Hot Topics
 1662
1662
 14
1418
52
1311
25
1261
29
1234
24
14
1418
52
1311
25
1261
29
1234
24

 Break or return from Java 8 stream forEach?
Feb 07, 2025 pm 12:09 PM
Break or return from Java 8 stream forEach?
Feb 07, 2025 pm 12:09 PM
Java 8 introduces the Stream API, providing a powerful and expressive way to process data collections. However, a common question when using Stream is: How to break or return from a forEach operation? Traditional loops allow for early interruption or return, but Stream's forEach method does not directly support this method. This article will explain the reasons and explore alternative methods for implementing premature termination in Stream processing systems. Further reading: Java Stream API improvements Understand Stream forEach The forEach method is a terminal operation that performs one operation on each element in the Stream. Its design intention is
 PHP: A Key Language for Web Development
Apr 13, 2025 am 12:08 AM
PHP: A Key Language for Web Development
Apr 13, 2025 am 12:08 AM
PHP is a scripting language widely used on the server side, especially suitable for web development. 1.PHP can embed HTML, process HTTP requests and responses, and supports a variety of databases. 2.PHP is used to generate dynamic web content, process form data, access databases, etc., with strong community support and open source resources. 3. PHP is an interpreted language, and the execution process includes lexical analysis, grammatical analysis, compilation and execution. 4.PHP can be combined with MySQL for advanced applications such as user registration systems. 5. When debugging PHP, you can use functions such as error_reporting() and var_dump(). 6. Optimize PHP code to use caching mechanisms, optimize database queries and use built-in functions. 7
 PHP vs. Python: Understanding the Differences
Apr 11, 2025 am 12:15 AM
PHP vs. Python: Understanding the Differences
Apr 11, 2025 am 12:15 AM
PHP and Python each have their own advantages, and the choice should be based on project requirements. 1.PHP is suitable for web development, with simple syntax and high execution efficiency. 2. Python is suitable for data science and machine learning, with concise syntax and rich libraries.
 PHP vs. Other Languages: A Comparison
Apr 13, 2025 am 12:19 AM
PHP vs. Other Languages: A Comparison
Apr 13, 2025 am 12:19 AM
PHP is suitable for web development, especially in rapid development and processing dynamic content, but is not good at data science and enterprise-level applications. Compared with Python, PHP has more advantages in web development, but is not as good as Python in the field of data science; compared with Java, PHP performs worse in enterprise-level applications, but is more flexible in web development; compared with JavaScript, PHP is more concise in back-end development, but is not as good as JavaScript in front-end development.
 PHP vs. Python: Core Features and Functionality
Apr 13, 2025 am 12:16 AM
PHP vs. Python: Core Features and Functionality
Apr 13, 2025 am 12:16 AM
PHP and Python each have their own advantages and are suitable for different scenarios. 1.PHP is suitable for web development and provides built-in web servers and rich function libraries. 2. Python is suitable for data science and machine learning, with concise syntax and a powerful standard library. When choosing, it should be decided based on project requirements.
 Java Program to Find the Volume of Capsule
Feb 07, 2025 am 11:37 AM
Java Program to Find the Volume of Capsule
Feb 07, 2025 am 11:37 AM
Capsules are three-dimensional geometric figures, composed of a cylinder and a hemisphere at both ends. The volume of the capsule can be calculated by adding the volume of the cylinder and the volume of the hemisphere at both ends. This tutorial will discuss how to calculate the volume of a given capsule in Java using different methods. Capsule volume formula The formula for capsule volume is as follows: Capsule volume = Cylindrical volume Volume Two hemisphere volume in, r: The radius of the hemisphere. h: The height of the cylinder (excluding the hemisphere). Example 1 enter Radius = 5 units Height = 10 units Output Volume = 1570.8 cubic units explain Calculate volume using formula: Volume = π × r2 × h (4
 PHP's Impact: Web Development and Beyond
Apr 18, 2025 am 12:10 AM
PHP's Impact: Web Development and Beyond
Apr 18, 2025 am 12:10 AM
PHPhassignificantlyimpactedwebdevelopmentandextendsbeyondit.1)ItpowersmajorplatformslikeWordPressandexcelsindatabaseinteractions.2)PHP'sadaptabilityallowsittoscaleforlargeapplicationsusingframeworkslikeLaravel.3)Beyondweb,PHPisusedincommand-linescrip
 PHP: The Foundation of Many Websites
Apr 13, 2025 am 12:07 AM
PHP: The Foundation of Many Websites
Apr 13, 2025 am 12:07 AM
The reasons why PHP is the preferred technology stack for many websites include its ease of use, strong community support, and widespread use. 1) Easy to learn and use, suitable for beginners. 2) Have a huge developer community and rich resources. 3) Widely used in WordPress, Drupal and other platforms. 4) Integrate tightly with web servers to simplify development deployment.
