

How to use JVM monitoring and analysis tools in UAVStack

Introduction
As AllInOne’s intelligent service technology stack, UAVStack provides a very comprehensive monitoring data sampling function and supports data monitoring and early warning. Recently, we have integrated the original data collection and display functions, added JVM analysis functions, and launched a more easy-to-use JVM monitoring and analysis tool.
Developers who are familiar with JDK know that JDK itself provides a set of JVM analysis tools, including jinfo, jmap, jstack, etc. Users can easily obtain JVM memory stack information, memory object allocation, and basic JVM startup parameter information through the command line. However, these tools need to be executed in a command line environment, and in a production environment they need to be forwarded through the bastion host.
Some good JVM analysis tools in the open source community can also provide functions such as obtaining basic JVM information, tracing stacks, and obtaining memory information, but they also require the support of the command line CLI.
The JVM monitoring and analysis tool launched by UAVStack provides a page-based display method to graphically display the collected monitoring data; it also provides basic JVM parameter acquisition, memory dump, thread analysis, memory allocation sampling and hot spots. Method analysis and other functions.
1. Architecture
The JVM monitoring and analysis tool is based on the existing architecture of UAVStack and is divided into front-end, back-end and middleware enhanced framework (MOF). Among them:
The front-end is responsible for displaying data and sending user execution instructions to the background;
The background is responsible for issuing instructions, responding to user queries, and processing collection The data received;
The middleware enhancement framework (MOF) is responsible for receiving the instructions issued by the background, executing the instructions and returning the data or writing the data to the file, and then returns the file provided by UAV. Set function to upload data.
The overall architecture process is shown in the figure below:

2. Key technologies
2.1 JMX
JMX provides relevant interfaces to obtain basic JVM monitoring data, such as memory heap size, GC status, etc., which is the basis of JVM monitoring data.
2.2 Middleware Enhancement Framework (MOF)
As the basis of the entire link of analysis tools, MOF is dependent on user applications and mainly provides the following basic support:
Basic data collection: When MOF is embedded in an application, JMX regularly obtains and reports basic information data of relevant JVMs, providing a data basis for display and early warning.
Request capture, instruction execution: Most functions of JVM monitoring and analysis tools require issuing instructions to the server where the application is located. MOF is responsible for intercepting requests to issue instructions, executing them and returning corresponding results.
2.3 Java Attach API
Java Attach API is a set of non-standard APIs provided by Sun, which can connect users to running virtual machine processes for Agent mounting and other operations.
In the JVM monitoring and analysis tool, the Java Attach API is mainly used to Attach to the virtual machine process and perform the following operations:
Get JMX Connection: Get the JVMConnection from the outside, Get MXBean and capture running data. (CPU sampling analysis)
Get the VirtualMachine object: call the interface to get the heap memory distribution information. (Memory sampling analysis)
3. Function display
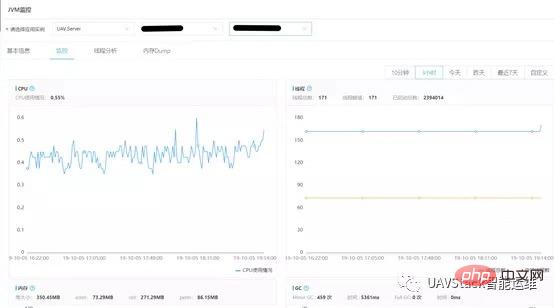
3.1 Basic monitoring
After selecting the application instance, you can enter the basic monitoring page.
This page mainly displays CPU usage, thread status, memory usage and GC status. Users can adjust the time range according to needs and view monitoring data in different periods.
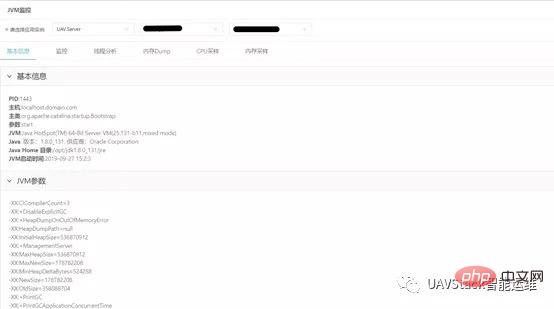
3.2 JVM Summary
The JVM summary page displays the basic parameter information of the current virtual machine, including basic information, JVM parameters and system properties. Among them:
Basic information includes the most basic and important information such as pid, host information, startup parameters, and JVM startup time;
JVM parameters include all JVM startup parameters. Users can view the specified heap size, garbage collector information, etc.;
System properties include all configuration information written in System.Properties and Javaagent Configuration properties.
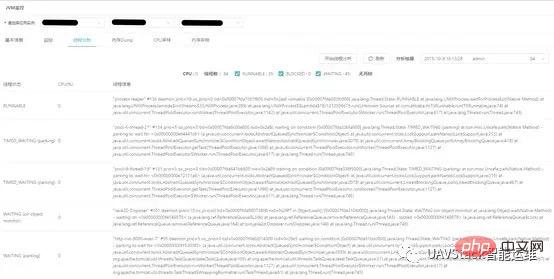
3.3 Thread analysis
Thread analysis obtains the basic information of the thread by executing jstack, and analyzes the output results to obtain the thread status Quantity, deadlock and other information.
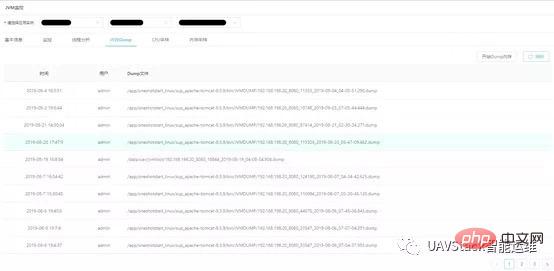
3.4 Memory Dump
Memory Dump obtains the stack dump file of the specified JVM by executing jmap.
Users can easily generate dumps on the front end with one click without logging in to the bastion machine. Click "Refresh" to view recent dump memory operation records.
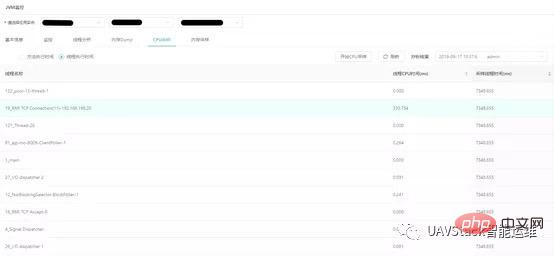
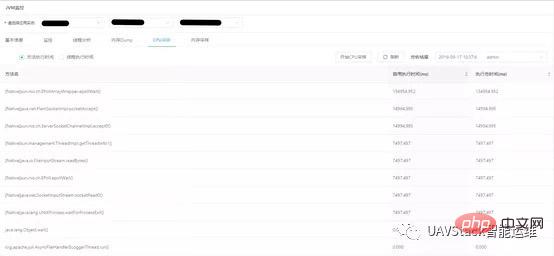
3.5 CPU analysis
CPU analysis is based on thread stack sampling analysis and mainly provides two functions: thread execution time and method hotspot sampling.
Thread execution time refers to the activity time of the thread during the sampling period. The query results are sorted according to the total thread activity time, and the thread name and thread execution time information are also provided, so that users can judge the execution status of the application.
Method hotspot sampling counts the execution time of all methods and provides class name and method name information of the method. Among them, the self-execution time of a method does not include the execution time of the method calling other methods. The query results are sorted in descending order according to the self-execution time of the method. Users can view the longer execution methods within the current application to determine whether the application is abnormal and needs optimization.
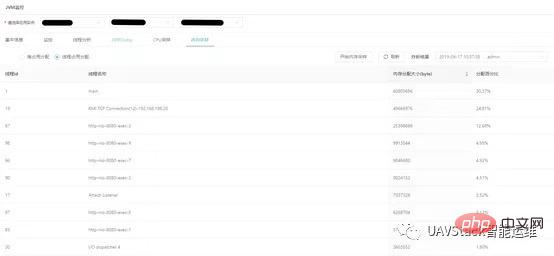
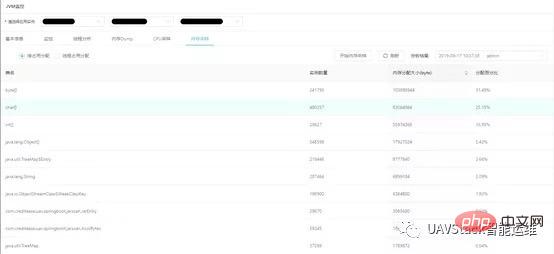
3.6 Memory analysis
Memory analysis is a statistical sampling analysis based on threads and heaps. It mainly provides two functions: each Thread memory allocation and heap allocation details.
Thread memory allocation provides information such as the memory allocation size and thread name of each thread, arranged in descending order according to the memory allocation size. Users can view the threads currently occupying a large amount of memory.
In-heap allocation provides the number of allocated instances of each class in the heap and the heap memory occupied. According to the heap Sort by memory size in descending order. Users can use this function as a simple dump and analysis tool to quickly analyze memory allocation and discover memory allocation problems.
The above is the detailed content of How to use JVM monitoring and analysis tools in UAVStack. For more information, please follow other related articles on the PHP Chinese website!

Hot AI Tools

Undresser.AI Undress
AI-powered app for creating realistic nude photos

AI Clothes Remover
Online AI tool for removing clothes from photos.

Undress AI Tool
Undress images for free

Clothoff.io
AI clothes remover

Video Face Swap
Swap faces in any video effortlessly with our completely free AI face swap tool!

Hot Article
Hot Tools

Notepad++7.3.1
Easy-to-use and free code editor

SublimeText3 Chinese version
Chinese version, very easy to use

Zend Studio 13.0.1
Powerful PHP integrated development environment

Dreamweaver CS6
Visual web development tools

SublimeText3 Mac version
God-level code editing software (SublimeText3)
Hot Topics
 1664
1664
 14
1423
52
1317
25
1268
29
1246
24
14
1423
52
1317
25
1268
29
1246
24

 A distributed JVM monitoring tool, very practical!
Aug 15, 2023 pm 05:15 PM
A distributed JVM monitoring tool, very practical!
Aug 15, 2023 pm 05:15 PM
This project is designed to facilitate developers to monitor multiple remote host JVMs faster. If your project is Spring boot, it is very easy to integrate. Just introduce the jar package. If it is not Spring boot, don’t be discouraged. You can quickly initialize a Spring boot program and introduce it yourself. Jar package is enough
 JVM memory management key points and precautions
Feb 20, 2024 am 10:26 AM
JVM memory management key points and precautions
Feb 20, 2024 am 10:26 AM
Key points and precautions for mastering JVM memory usage JVM (JavaVirtualMachine) is the environment in which Java applications run, and the most important one is the memory management of the JVM. Properly managing JVM memory can not only improve application performance, but also avoid problems such as memory leaks and memory overflows. This article will introduce the key points and considerations of JVM memory usage and provide some specific code examples. JVM memory partitions JVM memory is mainly divided into the following areas: Heap (He
 Detailed explanation of JVM command line parameters: the secret weapon to control JVM operation
May 09, 2024 pm 01:33 PM
Detailed explanation of JVM command line parameters: the secret weapon to control JVM operation
May 09, 2024 pm 01:33 PM
JVM command line parameters allow you to adjust JVM behavior at a fine-grained level. The common parameters include: Set the Java heap size (-Xms, -Xmx) Set the new generation size (-Xmn) Enable the parallel garbage collector (-XX:+UseParallelGC) Reduce the memory usage of the Survivor area (-XX:-ReduceSurvivorSetInMemory) Eliminate redundancy Eliminate garbage collection (-XX:-EliminateRedundantGCs) Print garbage collection information (-XX:+PrintGC) Use the G1 garbage collector (-XX:-UseG1GC) Set the maximum garbage collection pause time (-XX:MaxGCPau
 Java Error: JVM memory overflow error, how to deal with and avoid
Jun 24, 2023 pm 02:19 PM
Java Error: JVM memory overflow error, how to deal with and avoid
Jun 24, 2023 pm 02:19 PM
Java is a popular programming language. During the development of Java applications, you may encounter JVM memory overflow errors. This error usually causes the application to crash, affecting the user experience. This article will explore the causes of JVM memory overflow errors and how to deal with and avoid such errors. What is JVM memory overflow error? The Java Virtual Machine (JVM) is the running environment for Java applications. In the JVM, memory is divided into multiple areas, including heap, method area, stack, etc. The heap is used to store created objects
 Analysis of the functions and principles of JVM virtual machine
Feb 22, 2024 pm 01:54 PM
Analysis of the functions and principles of JVM virtual machine
Feb 22, 2024 pm 01:54 PM
An introduction to the analysis of the functions and principles of the JVM virtual machine: The JVM (JavaVirtualMachine) virtual machine is one of the core components of the Java programming language, and it is one of the biggest selling points of Java. The role of the JVM is to compile Java source code into bytecodes and be responsible for executing these bytecodes. This article will introduce the role of JVM and how it works, and provide some code examples to help readers understand better. Function: The main function of JVM is to solve the problem of portability of Java programs on different platforms.
 Demystifying the working principle of JVM: In-depth exploration of the principles of Java virtual machine
Feb 18, 2024 pm 12:28 PM
Demystifying the working principle of JVM: In-depth exploration of the principles of Java virtual machine
Feb 18, 2024 pm 12:28 PM
Detailed explanation of JVM principles: In-depth exploration of the working principle of the Java virtual machine requires specific code examples 1. Introduction With the rapid development and widespread application of the Java programming language, the Java Virtual Machine (JavaVirtualMachine, referred to as JVM) has also become indispensable in software development. a part of. As the running environment for Java programs, JVM can provide cross-platform features, allowing Java programs to run on different operating systems. In this article, we will delve into how the JVM works
 How to adjust JVM heap memory size efficiently?
Feb 18, 2024 pm 01:39 PM
How to adjust JVM heap memory size efficiently?
Feb 18, 2024 pm 01:39 PM
JVM memory parameter settings: How to reasonably adjust the heap memory size? In Java applications, the JVM is the key component responsible for managing memory. Among them, heap memory is used to store object instances. The size setting of heap memory has an important impact on the performance and stability of the application. This article will introduce how to reasonably adjust the heap memory size, with specific code examples. First, we need to understand some basic knowledge about JVM memory. The JVM's memory is divided into several areas, including heap memory, stack memory, method area, etc. in
 Java program to check if JVM is 32-bit or 64-bit
Sep 05, 2023 pm 06:37 PM
Java program to check if JVM is 32-bit or 64-bit
Sep 05, 2023 pm 06:37 PM
Before writing a java program to check whether the JVM is 32-bit or 64-bit, let us first discuss about the JVM. JVM is a java virtual machine, responsible for executing bytecode. It is part of the Java Runtime Environment (JRE). We all know that java is platform independent, but JVM is platform dependent. We need separate JVM for each operating system. If we have the bytecode of any java source code, we can easily run it on any platform due to JVM. The entire process of java file execution is as follows - First, we save the java source code with .java extension and the compiler converts it into bytecode with .class extension. This happens at compile time. Now, at runtime, J
