

Using Python to implement point cloud ground detection

1. Computer Vision Coordinate System
Before starting, it is important to understand the traditional coordinate system in computer vision. This is followed by Open3D and the Microsoft Kinect sensor. In computer vision, images are represented by a separate 2D coordinate system, where the x-axis points from left to right and the y-axis points up and down. For a camera, the origin of the 3D coordinate system is at the focus of the camera, with the x-axis pointing to the right, the y-axis pointing down, and the z-axis pointing forward.
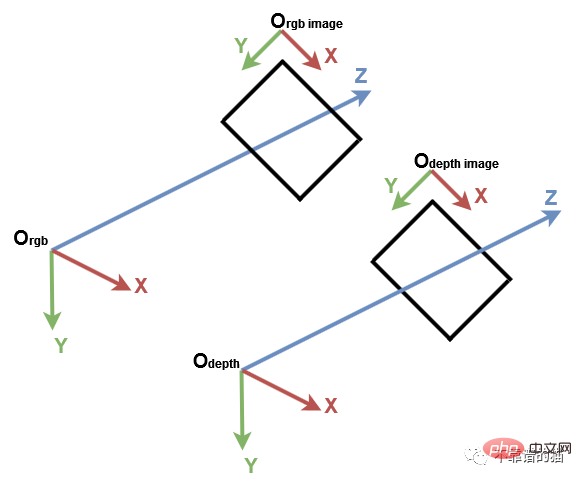
Computer Vision Coordinate System
We first import the required Python library:
import numpy as np
import open3d as o3d
For better understanding, let’s start with PLY file, use Open3D to create the default 3D coordinate system and display them:
# Read point cloud:
pcd = o3d.io.read_point_cloud("data/depth_2_pcd.ply")
# Create a 3D coordinate system:
origin = o3d.geometry.TriangleMesh.create_coordinate_frame(size=0.5)
# geometries to draw:
geometries = [pcd, origin]
# Visualize:
o3d.visualization.draw_geometries(geometries)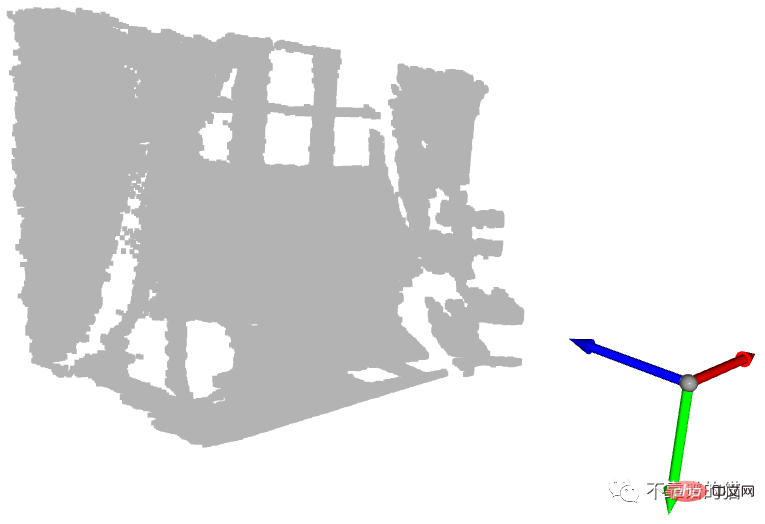
With coordinate system The point cloud displayed at the origin
The blue arrow is the Z-axis, the red arrow is the X-axis, and the green arrow is the Y-axis. You can see that the point cloud is represented in the same coordinate system as the Open3D coordinate system. Now, let's get the points with the minimum and maximum values for each axis:
# Get max and min points of each axis x, y and z:
x_max = max(pcd.points, key=lambda x: x[0])
y_max = max(pcd.points, key=lambda x: x[1])
z_max = max(pcd.points, key=lambda x: x[2])
x_min = min(pcd.points, key=lambda x: x[0])
y_min = min(pcd.points, key=lambda x: x[1])
z_min = min(pcd.points, key=lambda x: x[2])
We can print them, but for better visualization, we create a sphere at each point location. By default, Open3D creates 3D geometries at the origin position:
To move the sphere to a given position, a translation transformation is required. In the example below, the spheres are translated by the vector [1,1,1]:
Let's go back to our example and assign each sphere a color. For each position, we create a sphere and translate it to that position. Then we assign the correct color and finally we add it to the display.
# Colors:
RED = [1., 0., 0.]
GREEN = [0., 1., 0.]
BLUE = [0., 0., 1.]
YELLOW = [1., 1., 0.]
MAGENTA = [1., 0., 1.]
CYAN = [0., 1., 1.]


positions = [x_max, y_max, z_max, x_min, y_min, z_min]
colors = [RED, GREEN, BLUE, MAGENTA, YELLOW, CYAN]
for i in range(len(positions)):
 # Create a sphere mesh:
 sphere = o3d.geometry.TriangleMesh.create_sphere(radius=0.05)
 # move to the point position:
 sphere.translate(np.asarray(positions[i]))
 # add color:
 sphere.paint_uniform_color(np.asarray(colors[i]))
 # compute normals for vertices or faces:
 sphere.compute_vertex_normals()
 # add to geometry list to display later:
 geometries.append(sphere)


# Display:
o3d.visualization.draw_geometries(geometries)
In fact, the y-axis represents the height of the point: in the real world, the highest ball is the yellow ball, and the lowest ball is the green ball. However, since the y-axis is downward, the yellow sphere has the smallest value and the green sphere has the largest value.
Another interesting sphere is the cyan sphere at the origin. As we mentioned in the previous tutorial, pixels with a depth value of 0 are noise points, so the point located at the origin is the point calculated from these noise pixels (when z=0, then x=0 and y= 0).
2. Ground Detection
Now that we have shown some important points, how to perform ground detection? In the previous example, the green sphere is located on the ground. To be precise, its center corresponds to the highest point along the y-axis which is a ground point. Suppose for ground detection we change the color of all points with y_max to green
If you display the point cloud, you will notice that not all ground points are green. In fact, only one point, corresponding to the center of the previous green sphere, is green. This is due to depth camera accuracy and noise.
To overcome this limitation, we need to add a threshold so that points with y coordinates of [y_max-threshold, y_max] are considered ground points. To do this, after getting y_max, we check if the y coordinate of each point is within the interval and then set its color to green. Finally, the color attributes of the point cloud are updated and the results are displayed.
# Define a threshold:
THRESHOLD = 0.075


# Get the max value along the y-axis:
y_max = max(pcd.points, key=lambda x: x[1])[1]


# Get the original points color to be updated:
pcd_colors = np.asarray(pcd.colors)


# Number of points:
n_points = pcd_colors.shape[0]


# update color:
for i in range(n_points):
# if the current point is aground point:
if pcd.points[i][1] >= y_max - THRESHOLD:
pcd_colors[i] = GREEN# color it green


pcd.colors = o3d.utility.Vector3dVector(pcd_colors)


# Display:
o3d.visualization.draw_geometries([pcd, origin])
In this example, we will only color the points representing the ground green. In real-world applications, the ground is extracted to define walkable areas, such as robots or visually impaired systems, or to place objects on them, such as interior design systems. It can also be removed, so the remaining points can be segmented or classified, as in scene understanding and object detection systems.
3. Organized point cloud
We know that a point cloud is defined as a set of 3D points. A set is an unordered structure, so the point cloud represented by the set is called an unorganized point cloud. Similar to the RGB matrix, the organized point cloud is a 2D matrix with 3 channels representing the x, y and z coordinates of the points. The matrix structure provides the relationship between adjacent points, thereby reducing the time complexity of some algorithms, such as the nearest neighbor algorithm.
For example, we are writing a research paper and we want to show the results of our detection algorithm in the form of graphs. We can either take a screenshot of the point cloud or display the results on a depth image, as shown below. In my opinion, the second option is the best. In this case, an organized point cloud is needed to save the positions of depth pixels.
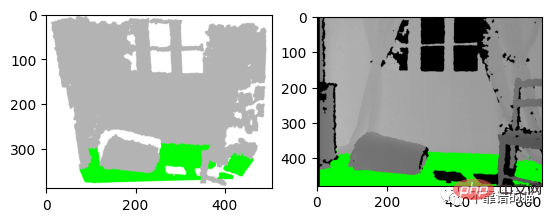
左:3D 可视化的屏幕截图 右:深度图像的结果
让我们从之前的深度图像创建一个有组织的点云。我们首先导入相机参数。我们还导入深度图像并将其转换为3通道灰度图像,以便我们可以将地面像素设置为绿色:
import imageio.v3 as iio
import numpy as np
import matplotlib.pyplot as plt


# Camera parameters:
FX_DEPTH = 5.8262448167737955e+02
FY_DEPTH = 5.8269103270988637e+02
CX_DEPTH = 3.1304475870804731e+02
CY_DEPTH = 2.3844389626620386e+02


# Read depth image:
depth_image = iio.imread('../data/depth_2.png')
# Compute the grayscale image:
depth_grayscale = np.array(256 * depth_image / 0x0fff, dtype=np.uint8)
# Convert a grayscale image to a 3-channel image:
depth_grayscale = np.stack((depth_grayscale,) * 3, axis=-1)要计算一个有组织的点云,我们使用与上一篇教程相同的方法(Python:基于 RGB-D 图像的点云计算)。我们没有将深度图像扁平化,而是将jj和ii重塑为与深度图像相同的形状,如下所示:
# get depth image resolution:
height, width = depth_image.shape
# compute indices and reshape it to have the same shape as the depth image:
jj = np.tile(range(width), height).reshape((height, width))
ii = np.repeat(range(height), width).reshape((height, width))
# Compute constants:
xx = (jj - CX_DEPTH) / FX_DEPTH
yy = (ii - CY_DEPTH) / FY_DEPTH
# compute organised point cloud:
organized_pcd = np.dstack((xx * depth_image, yy * depth_image, depth_image))
如果你打印出创建的点云的形状,你可以看到它是一个有3个通道的矩阵(480,640,3)。如果你觉得这个代码很难理解,请回到之前的教程(Python:基于 RGB-D 图像的点云计算)。
类似地,我们像上面那样检测地面,但不是更新点的颜色并显示点云,而是更新灰度图像的像素并显示它:
# Ground_detection:
THRESHOLD = 0.075 * 1000# Define a threshold
y_max = max(organized_pcd.reshape((height * width, 3)), key=lambda x: x[1])[
1]# Get the max value along the y-axis


# Set the ground pixels to green:
for i in range(height):
for j in range(width):
if organized_pcd[i][j][1] >= y_max - THRESHOLD:
depth_grayscale[i][j] = [0, 255, 0]# Update the depth image


# Display depth_grayscale:
plt.imshow(depth_grayscale)
plt.show()
4.结论
在本教程中,为了熟悉点云,我们引入了默认坐标系统,并实现了一个简单的地面检测算法。事实上,地面检测在某些应用(如导航)中是一项重要的任务,文献中已经提出了几种算法。实现算法简单;它认为最低点是地面。然而,它的限制是,深度相机必须与地面平行,这是大多数现实应用的情况不是这样的。
The above is the detailed content of Using Python to implement point cloud ground detection. For more information, please follow other related articles on the PHP Chinese website!

Hot AI Tools

Undresser.AI Undress
AI-powered app for creating realistic nude photos

AI Clothes Remover
Online AI tool for removing clothes from photos.

Undress AI Tool
Undress images for free

Clothoff.io
AI clothes remover

Video Face Swap
Swap faces in any video effortlessly with our completely free AI face swap tool!

Hot Article
Hot Tools

Notepad++7.3.1
Easy-to-use and free code editor

SublimeText3 Chinese version
Chinese version, very easy to use

Zend Studio 13.0.1
Powerful PHP integrated development environment

Dreamweaver CS6
Visual web development tools

SublimeText3 Mac version
God-level code editing software (SublimeText3)
Hot Topics
 1664
1664
 14
1423
52
1317
25
1268
29
1243
24
14
1423
52
1317
25
1268
29
1243
24

 PHP and Python: Different Paradigms Explained
Apr 18, 2025 am 12:26 AM
PHP and Python: Different Paradigms Explained
Apr 18, 2025 am 12:26 AM
PHP is mainly procedural programming, but also supports object-oriented programming (OOP); Python supports a variety of paradigms, including OOP, functional and procedural programming. PHP is suitable for web development, and Python is suitable for a variety of applications such as data analysis and machine learning.
 Choosing Between PHP and Python: A Guide
Apr 18, 2025 am 12:24 AM
Choosing Between PHP and Python: A Guide
Apr 18, 2025 am 12:24 AM
PHP is suitable for web development and rapid prototyping, and Python is suitable for data science and machine learning. 1.PHP is used for dynamic web development, with simple syntax and suitable for rapid development. 2. Python has concise syntax, is suitable for multiple fields, and has a strong library ecosystem.
 PHP and Python: A Deep Dive into Their History
Apr 18, 2025 am 12:25 AM
PHP and Python: A Deep Dive into Their History
Apr 18, 2025 am 12:25 AM
PHP originated in 1994 and was developed by RasmusLerdorf. It was originally used to track website visitors and gradually evolved into a server-side scripting language and was widely used in web development. Python was developed by Guidovan Rossum in the late 1980s and was first released in 1991. It emphasizes code readability and simplicity, and is suitable for scientific computing, data analysis and other fields.
 Python vs. JavaScript: The Learning Curve and Ease of Use
Apr 16, 2025 am 12:12 AM
Python vs. JavaScript: The Learning Curve and Ease of Use
Apr 16, 2025 am 12:12 AM
Python is more suitable for beginners, with a smooth learning curve and concise syntax; JavaScript is suitable for front-end development, with a steep learning curve and flexible syntax. 1. Python syntax is intuitive and suitable for data science and back-end development. 2. JavaScript is flexible and widely used in front-end and server-side programming.
 How to run sublime code python
Apr 16, 2025 am 08:48 AM
How to run sublime code python
Apr 16, 2025 am 08:48 AM
To run Python code in Sublime Text, you need to install the Python plug-in first, then create a .py file and write the code, and finally press Ctrl B to run the code, and the output will be displayed in the console.
 Golang vs. Python: Performance and Scalability
Apr 19, 2025 am 12:18 AM
Golang vs. Python: Performance and Scalability
Apr 19, 2025 am 12:18 AM
Golang is better than Python in terms of performance and scalability. 1) Golang's compilation-type characteristics and efficient concurrency model make it perform well in high concurrency scenarios. 2) Python, as an interpreted language, executes slowly, but can optimize performance through tools such as Cython.
 Where to write code in vscode
Apr 15, 2025 pm 09:54 PM
Where to write code in vscode
Apr 15, 2025 pm 09:54 PM
Writing code in Visual Studio Code (VSCode) is simple and easy to use. Just install VSCode, create a project, select a language, create a file, write code, save and run it. The advantages of VSCode include cross-platform, free and open source, powerful features, rich extensions, and lightweight and fast.
 How to run python with notepad
Apr 16, 2025 pm 07:33 PM
How to run python with notepad
Apr 16, 2025 pm 07:33 PM
Running Python code in Notepad requires the Python executable and NppExec plug-in to be installed. After installing Python and adding PATH to it, configure the command "python" and the parameter "{CURRENT_DIRECTORY}{FILE_NAME}" in the NppExec plug-in to run Python code in Notepad through the shortcut key "F6".
