

How to process Excel data with Python's Pandas library?

1. Read xlsx table: pd.read_excel()
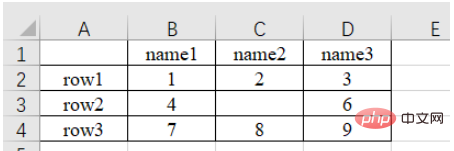
The original content is as follows:
a) Read the nth Sheet (sub-table, you can view or add or delete sub-tables in the lower left) data
import pandas as pd
# 每次都需要修改的路径
path = "test.xlsx"
# sheet_name默认为0,即读取第一个sheet的数据
sheet = pd.read_excel(path, sheet_name=0)
print(sheet)
"""
  Unnamed: 0  name1  name2  name3
0       row1      1    2.0      3
1       row2      4    NaN      6
2       row3      7    8.0      9
"""
It can be noticed that there is no content in the upper left corner of the original form, and the read result is "Unnamed : 0", this is because the read_excel function will default the first row of the table as the column index name . In addition, for row index names, numbering starts from the second row by default (because the default first row is the column index name, so the default first row is not data). If not specifically specified, numbering starts from 0 automatically, as follows.
sheet = pd.read_excel(path)
# 查看列索引名,返回列表形式
print(sheet.columns.values)
# 查看行索引名,默认从第二行开始编号,如果不特意指定,则自动从0开始编号,返回列表形式
print(sheet.index.values)
"""
['Unnamed: 0' 'name1' 'name2' 'name3']
[0 1 2]
"""
b) The column index name can also be customized, as follows:
sheet = pd.read_excel(path, names=['col1', 'col2', 'col3', 'col4'])
print(sheet)
# 查看列索引名,返回列表形式
print(sheet.columns.values)
"""
   col1  col2  col3  col4
0  row1     1   2.0     3
1  row2     4   NaN     6
2  row3     7   8.0     9
['col1' 'col2' 'col3' 'col4']
"""
c) You can also specify the nth column as the row index name , as follows:
# 指定第一列为行索引
sheet = pd.read_excel(path, index_col=0)
print(sheet)
"""
      name1  name2  name3
row1      1    2.0      3
row2      4    NaN      6
row3      7    8.0      9
"""d) Skip the nth row of data when reading
# 跳过第2行的数据(第一行索引为0)
sheet = pd.read_excel(path, skiprows=[1])
print(sheet)
"""
  Unnamed: 0  name1  name2  name3
0       row2      4    NaN      6
1       row3      7    8.0      9
"""
2. Get the data size of the table: shape
path = "test.xlsx"
# 指定第一列为行索引
sheet = pd.read_excel(path, index_col=0)
print(sheet)
print('==========================')
print('shape of sheet:', sheet.shape)
"""
      name1  name2  name3
row1      1    2.0      3
row2      4    NaN      6
row3      7    8.0      9
==========================
shape of sheet: (3, 3)
"""3. Method of indexing data: [ ] / loc[] / iloc[]
1. Directly add square brackets to index
You can use square brackets to add column names The method [col_name] is used to extract the data of a certain column, and then use square brackets plus the index number [index] to index the value of the specific position of this column. Here, the column named name1 is indexed, and then the data located in row 1 of the column (index is 1) is printed: 4, as follows:
sheet = pd.read_excel(path)
# 读取列名为 name1 的列数据
col = sheet['name1']
print(col)
# 打印该列第二个数据
print(col[1]) # 4
"""
0    1
1    4
2    7
Name: name1, dtype: int64
4
"""
2, iloc method, index by integer number
Use sheet.iloc[ ] index, the square brackets are the integer position numbers of the rows and columns (starting from 0 after excluding the column as the row index and the row as the column index) serial number).
a) sheet.iloc[1, 2]: Extract row 2, column 3 data. The first is the row index, the second is the column index
b) sheet.iloc[0: 2]: Extract the first two rowsdata
c) sheet.iloc[0:2, 0:2]: Extract the first two columns data of the first two rows through sharding
# 指定第一列数据为行索引
sheet = pd.read_excel(path, index_col=0)
# 读取第2行(row2)的第3列(6)数据
# 第一个是行索引,第二个是列索引
data = sheet.iloc[1, 2]
print(data)  # 6
print('================================')
# 通过分片的方式提取 前两行 数据
data_slice = sheet.iloc[0:2]
print(data_slice)
print('================================')
# 通过分片的方式提取 前两行 的 前两列 数据
data_slice = sheet.iloc[0:2, 0:2]
print(data_slice)
"""
6
================================
      name1  name2  name3
row1      1    2.0      3
row2      4    NaN      6
================================
      name1  name2
row1      1    2.0
row2      4    NaN
"""3. loc method, index by row and column name
Use sheet.loc[ ] index, the square brackets are row and row The name string . The specific usage is the same as iloc , except that the integer index of iloc is replaced by the name index of the row and column. This indexing method is more intuitive to use.
Note: iloc[1: 2] does not contain 2, but loc['row1': 'row2'] does Contains 'row2'.
# 指定第一列数据为行索引
sheet = pd.read_excel(path, index_col=0)
# 读取第2行(row2)的第3列(6)数据
# 第一个是行索引,第二个是列索引
data = sheet.loc['row2', 'name3']
print(data)  # 1
print('================================')
# 通过分片的方式提取 前两行 数据
data_slice = sheet.loc['row1': 'row2']
print(data_slice)
print('================================')
# 通过分片的方式提取 前两行 的 前两列 数据
data_slice1 = sheet.loc['row1': 'row2', 'name1': 'name2']
print(data_slice1)
"""
6
================================
      name1  name2  name3
row1      1    2.0      3
row2      4    NaN      6
================================
      name1  name2
row1      1    2.0
row2      4    NaN
"""4. Determine whether the data is empty: np.isnan() / pd.isnull()
1. Use isnan() or of the numpy library The isnull() method of the pandas library determines whether it is equal to nan .
sheet = pd.read_excel(path)
# 读取列名为 name1 的列数据
col = sheet['name2']

print(np.isnan(col[1]))  # True
print(pd.isnull(col[1]))  # True
"""
True
True
"""
2. Use str() to convert it to a string and determine whether it is equal to 'nan' .
sheet = pd.read_excel(path)
# 读取列名为 name1 的列数据
col = sheet['name2']
print(col)
# 打印该列第二个数据
if str(col[1]) == 'nan':
    print('col[1] is nan')
"""
0    2.0
1    NaN
2    8.0
Name: name2, dtype: float64
col[1] is nan
"""5. Find data that meets the conditions
Let’s understand the following code
# 提取name1 == 1 的行
mask = (sheet['name1'] == 1)
x = sheet.loc[mask]
print(x)
"""
      name1  name2  name3
row1      1    2.0      3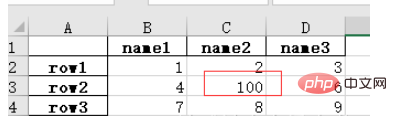
"""6. Modify element value: replace()
sheet['name2'].replace(2, 100, inplace=True) : Change element 2 of column name2 to element 100, and operate in place.
sheet['name2'].replace(2, 100, inplace=True)
print(sheet)
"""
      name1  name2  name3
row1      1  100.0      3
row2      4    NaN      6
row3      7    8.0      9
"""sheet['name2'].replace(np.nan, 100, inplace=True) : Change the empty element (nan) in the name2 column to element 100, operate in place .
import numpy as np
sheet['name2'].replace(np.nan, 100, inplace=True)
print(sheet)
print(type(sheet.loc['row2', 'name2']))
"""
      name1  name2  name3
row1      1    2.0      3
row2      4  100.0      6
row3      7    8.0      9
"""7. Add data: [ ]
To add a column, directly use square brackets [name to add] to add.
sheet['name_add'] = [55, 66, 77]: Add a column named name_add with a value of [55, 66, 77]
path = "test.xlsx"
# 指定第一列为行索引
sheet = pd.read_excel(path, index_col=0)
print(sheet)
print('====================================')
# 添加名为 name_add 的列,值为[55, 66, 77]
sheet['name_add'] = [55, 66, 77]
print(sheet)
"""
      name1  name2  name3
row1      1    2.0      3
row2      4    NaN      6
row3      7    8.0      9
====================================
      name1  name2  name3  name_add
row1      1    2.0      3        55
row2      4    NaN      6        66
row3      7    8.0      9        77
"""8. Delete data: del() / drop()
a) del(sheet['name3']): Use the del method to delete
sheet = pd.read_excel(path, index_col=0)
# 使用 del 方法删除 'name3' 的列
del(sheet['name3'])
print(sheet)
"""
      name1  name2
row1      1    2.0
row2      4    NaN
row3      7    8.0
"""b) sheet.drop('row1', axis=0)
Use the drop method to delete the row1 row. If the column is deleted, the corresponding axis=1.
When the inplace parameter is True, the parameter will not be returned and will be deleted directly on the original data.
When the inplace parameter is False (default), the original data will not be modified, but the modified data will be returned. Data
sheet.drop('row1', axis=0, inplace=True)
print(sheet)
"""
      name1  name2  name3
row2      4    NaN      6
row3      7    8.0      9
"""c)sheet.drop(labels=['name1', 'name2'], axis=1)
Use label=[ ] parameter to delete Multiple rows or columns
# 删除多列,默认 inplace 参数位 False,即会返回结果
print(sheet.drop(labels=['name1', 'name2'], axis=1))
"""
      name3
row1      3
row2      6
row3      9
"""9. Save to excel file: to_excel()
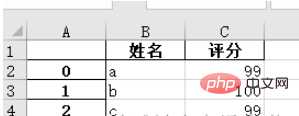
1. Save the data in pandas format as an .xlsx file
names = ['a', 'b', 'c']
scores = [99, 100, 99]
result_excel = pd.DataFrame()
result_excel["姓名"] = names
result_excel["评分"] = scores
# 写入excel
result_excel.to_excel('test3.xlsx')
2. Save the modified excel file as an .xlsx file.
For example, after modifying nan in the original table to 100, save the file:
import numpy as np
# 指定第一列为行索引
sheet = pd.read_excel(path, index_col=0)
sheet['name2'].replace(np.nan, 100, inplace=True)
sheet.to_excel('test2.xlsx')
Open test2.xlsx and the result is as follows:
The above is the detailed content of How to process Excel data with Python's Pandas library?. For more information, please follow other related articles on the PHP Chinese website!

Hot AI Tools

Undresser.AI Undress
AI-powered app for creating realistic nude photos

AI Clothes Remover
Online AI tool for removing clothes from photos.

Undress AI Tool
Undress images for free

Clothoff.io
AI clothes remover

Video Face Swap
Swap faces in any video effortlessly with our completely free AI face swap tool!

Hot Article
Hot Tools

Notepad++7.3.1
Easy-to-use and free code editor

SublimeText3 Chinese version
Chinese version, very easy to use

Zend Studio 13.0.1
Powerful PHP integrated development environment

Dreamweaver CS6
Visual web development tools

SublimeText3 Mac version
God-level code editing software (SublimeText3)
Hot Topics
 1666
1666
 14
1425
52
1327
25
1273
29
1252
24
14
1425
52
1327
25
1273
29
1252
24

 PHP and Python: Different Paradigms Explained
Apr 18, 2025 am 12:26 AM
PHP and Python: Different Paradigms Explained
Apr 18, 2025 am 12:26 AM
PHP is mainly procedural programming, but also supports object-oriented programming (OOP); Python supports a variety of paradigms, including OOP, functional and procedural programming. PHP is suitable for web development, and Python is suitable for a variety of applications such as data analysis and machine learning.
 Choosing Between PHP and Python: A Guide
Apr 18, 2025 am 12:24 AM
Choosing Between PHP and Python: A Guide
Apr 18, 2025 am 12:24 AM
PHP is suitable for web development and rapid prototyping, and Python is suitable for data science and machine learning. 1.PHP is used for dynamic web development, with simple syntax and suitable for rapid development. 2. Python has concise syntax, is suitable for multiple fields, and has a strong library ecosystem.
 How to run sublime code python
Apr 16, 2025 am 08:48 AM
How to run sublime code python
Apr 16, 2025 am 08:48 AM
To run Python code in Sublime Text, you need to install the Python plug-in first, then create a .py file and write the code, and finally press Ctrl B to run the code, and the output will be displayed in the console.
 PHP and Python: A Deep Dive into Their History
Apr 18, 2025 am 12:25 AM
PHP and Python: A Deep Dive into Their History
Apr 18, 2025 am 12:25 AM
PHP originated in 1994 and was developed by RasmusLerdorf. It was originally used to track website visitors and gradually evolved into a server-side scripting language and was widely used in web development. Python was developed by Guidovan Rossum in the late 1980s and was first released in 1991. It emphasizes code readability and simplicity, and is suitable for scientific computing, data analysis and other fields.
 Python vs. JavaScript: The Learning Curve and Ease of Use
Apr 16, 2025 am 12:12 AM
Python vs. JavaScript: The Learning Curve and Ease of Use
Apr 16, 2025 am 12:12 AM
Python is more suitable for beginners, with a smooth learning curve and concise syntax; JavaScript is suitable for front-end development, with a steep learning curve and flexible syntax. 1. Python syntax is intuitive and suitable for data science and back-end development. 2. JavaScript is flexible and widely used in front-end and server-side programming.
 Golang vs. Python: Performance and Scalability
Apr 19, 2025 am 12:18 AM
Golang vs. Python: Performance and Scalability
Apr 19, 2025 am 12:18 AM
Golang is better than Python in terms of performance and scalability. 1) Golang's compilation-type characteristics and efficient concurrency model make it perform well in high concurrency scenarios. 2) Python, as an interpreted language, executes slowly, but can optimize performance through tools such as Cython.
 Where to write code in vscode
Apr 15, 2025 pm 09:54 PM
Where to write code in vscode
Apr 15, 2025 pm 09:54 PM
Writing code in Visual Studio Code (VSCode) is simple and easy to use. Just install VSCode, create a project, select a language, create a file, write code, save and run it. The advantages of VSCode include cross-platform, free and open source, powerful features, rich extensions, and lightweight and fast.
 How to run python with notepad
Apr 16, 2025 pm 07:33 PM
How to run python with notepad
Apr 16, 2025 pm 07:33 PM
Running Python code in Notepad requires the Python executable and NppExec plug-in to be installed. After installing Python and adding PATH to it, configure the command "python" and the parameter "{CURRENT_DIRECTORY}{FILE_NAME}" in the NppExec plug-in to run Python code in Notepad through the shortcut key "F6".
