

Let's talk about how to use echarts to draw charts in React Native

How to draw charts in React Native? The following article will introduce to you how to use React Native Echarts to develop a real e-commerce data statistics page. I hope it will be helpful to you!

When writing charts related to daily needs, the most used chart library is echarts. The performance of echarts on the web side is quite mature, and the official solution is also provided for the mini program side, but there is no corresponding support for RN. Most of the solutions found on the market are essentially based on webview, and I prefer solutions based on RN. After all, the native experience will be better than the web one.
So we released @wuba/react-native-echarts to meet the demand. Those who are interested in the implementation principle can read here.
Next I will use @wuba/react-native-echarts to make an application in an actual project. The screenshot is as follows:
Tips
- If you already have an APP package, you can ignore the previous packaging process and jump directly to step 4.
- The complete code for the trial is on github, address: github.com/iambool/Tes…
The detailed usage process is as follows
1. Development environment setup
Set up the RN development environment locally. The construction process can be found online, so I won’t go into details.
2. Prepare RN project
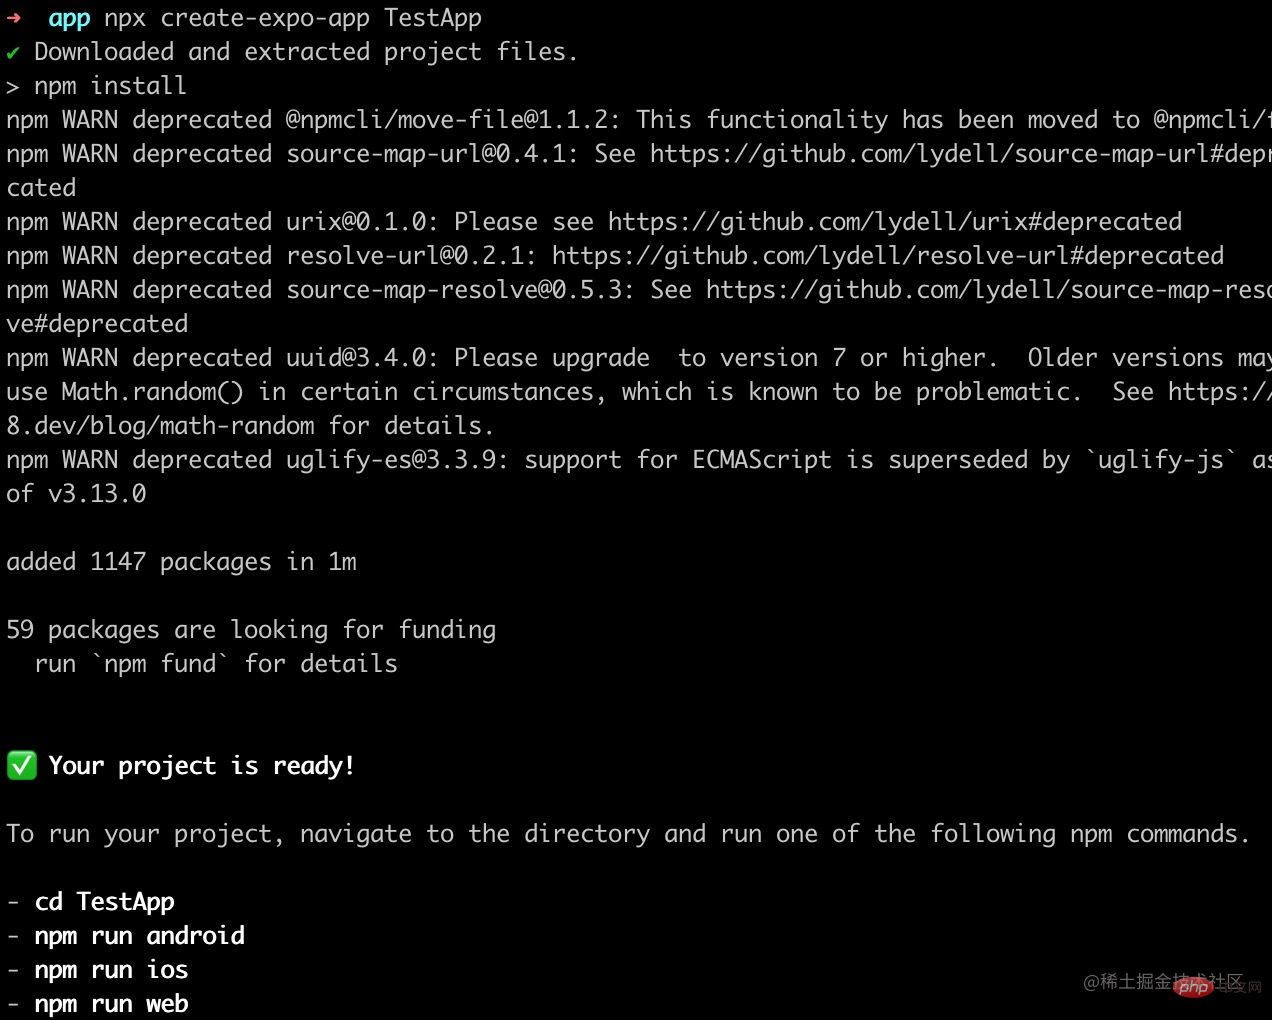
Because it is a trial, I used expo to newly initialize an RN project called TestApp.
npx create-expo-app TestApp
3. Build App package
Use the command line to generate the package ios android app package. It is recommended to use the simulator here for ios (no certificate required). For Android, I connected it to a real machine
yarn android
yarn ios
After generating the package, if the phone sees that the application has been installed, it means success.

4. Install related dependencies
yarn add @wuba/react-native-echarts echarts
yarn add @shopify/react-native-skia
yarn add react-native-svg
Note that if you are installing in an existing project, you must create a new package after the installation is completed, otherwise An error will be reported if native dependencies are missing;
5. Try Skia mode
@wuba/react-native-echarts supports two rendering modes (Skia and Svg) , use it first Skia Try a simple chart. It can be roughly divided into these small steps:
- Introduce echarts, chart components and other dependencies
- Register chart components
- Create chart instances and set the chart configuration ( option)
- When the page is destroyed, remember to destroy the chart instance synchronously
The specific code is as follows:
import { useRef, useEffect } from 'react';
import { View } from 'react-native';
/**
* 一、引入echarts依赖,这里先试下折线图
*/
import * as echarts from 'echarts/core';
import { LineChart } from 'echarts/charts';
import { GridComponent } from 'echarts/components';
import { SVGRenderer, SkiaChart } from '@wuba/react-native-echarts';
/**
* 二、注册需要用到的组件
* SVGRenderer: 是必须注册的
* LineChart: 因为用的折线图,所以要引入LineChart(如果不知道该引入哪些组件,就直接看报错,报错说缺什么就加什么)
* GridComponent: 这个就是报错的时候提示,然后我加的hhh
*/
echarts.use([SVGRenderer, LineChart, GridComponent]);
export default () => {
const skiaRef = useRef(null); // Ref用于保存图表实例
useEffect(() => {
/**
* 四、图表配置
*/
const option = {
xAxis: {
type: 'category',
data: ['Mon', 'Tue', 'Wed', 'Thu', 'Fri', 'Sat', 'Sun'],
},
yAxis: {
type: 'value',
},
series: [
{
data: [150, 230, 224, 218, 135, 147, 260],
type: 'line',
},
],
};
let chart;
if (skiaRef.current) {
/**
* 五、初始化图表,指定下宽高
*/
chart = echarts.init(skiaRef.current, 'light', {
renderer: 'svg',
width: 400,
height: 400,
});
chart.setOption(option);
}
/**
* 六、页面关闭后要销毁图表实例
*/
return () => chart?.dispose();
}, []);
return (
<View className='index'>
<SkiaChart ref={skiaRef} />
</View>
);
};After writing, shake the phone and it will appear when reloading the bundle Error report:
ERROR Invariant Violation: requireNativeComponent: "SkiaDomView" was not found in the UIManager.
Googled it and said it needed to bedowngraded solve. In fact, it needs to correspond to the expo version. When installing dependencies, there will be a prompt similar to this. Just install the prompted version.
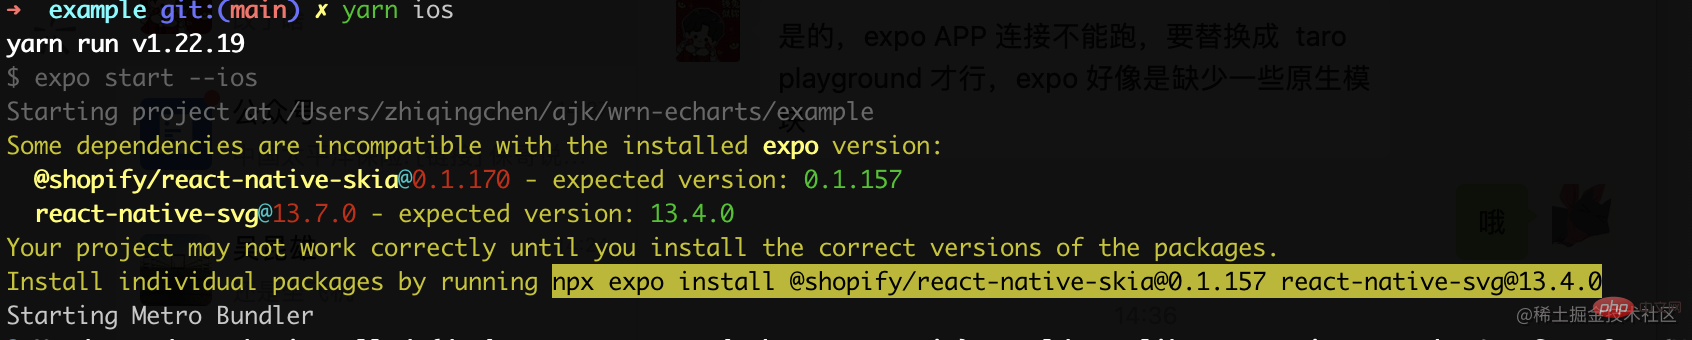
So I downgraded the version according to the prompts. :
@shopify/react-native-skia@0.1.157
react-native-svg@13.4.0
After rebuilding the app, it was loaded, and the needle did not poke; (Android covered the point, it seems that it should adapt to the screen width)
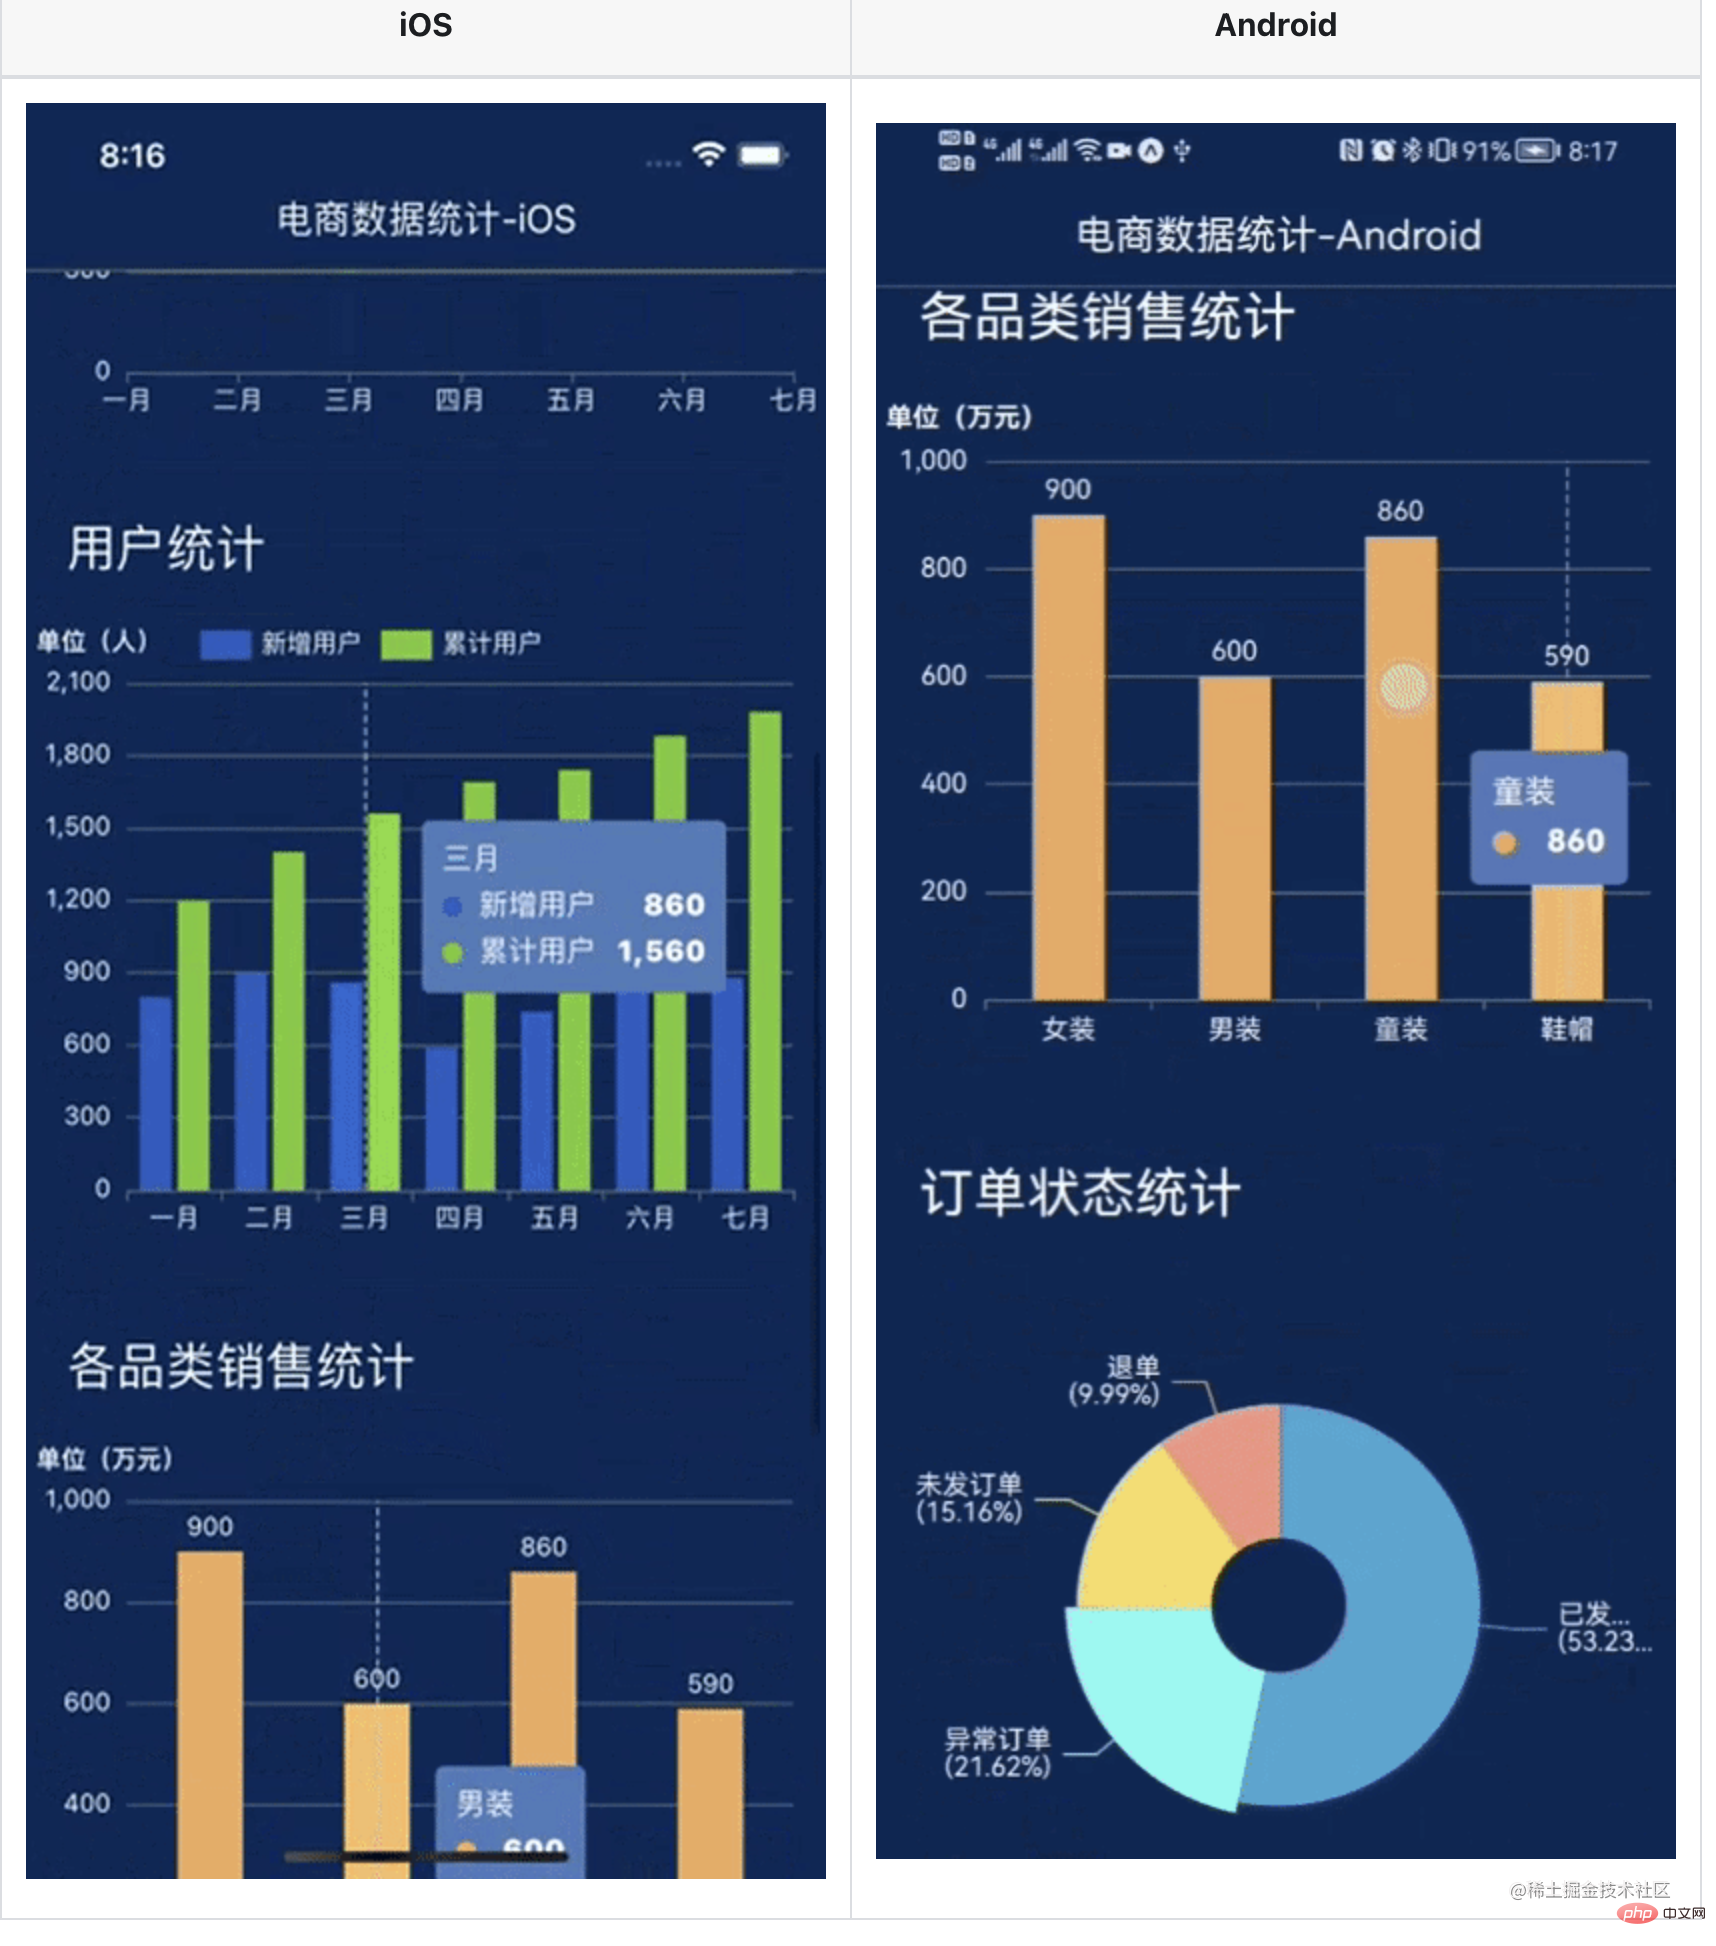
| iOS | Android |
|---|---|
 | 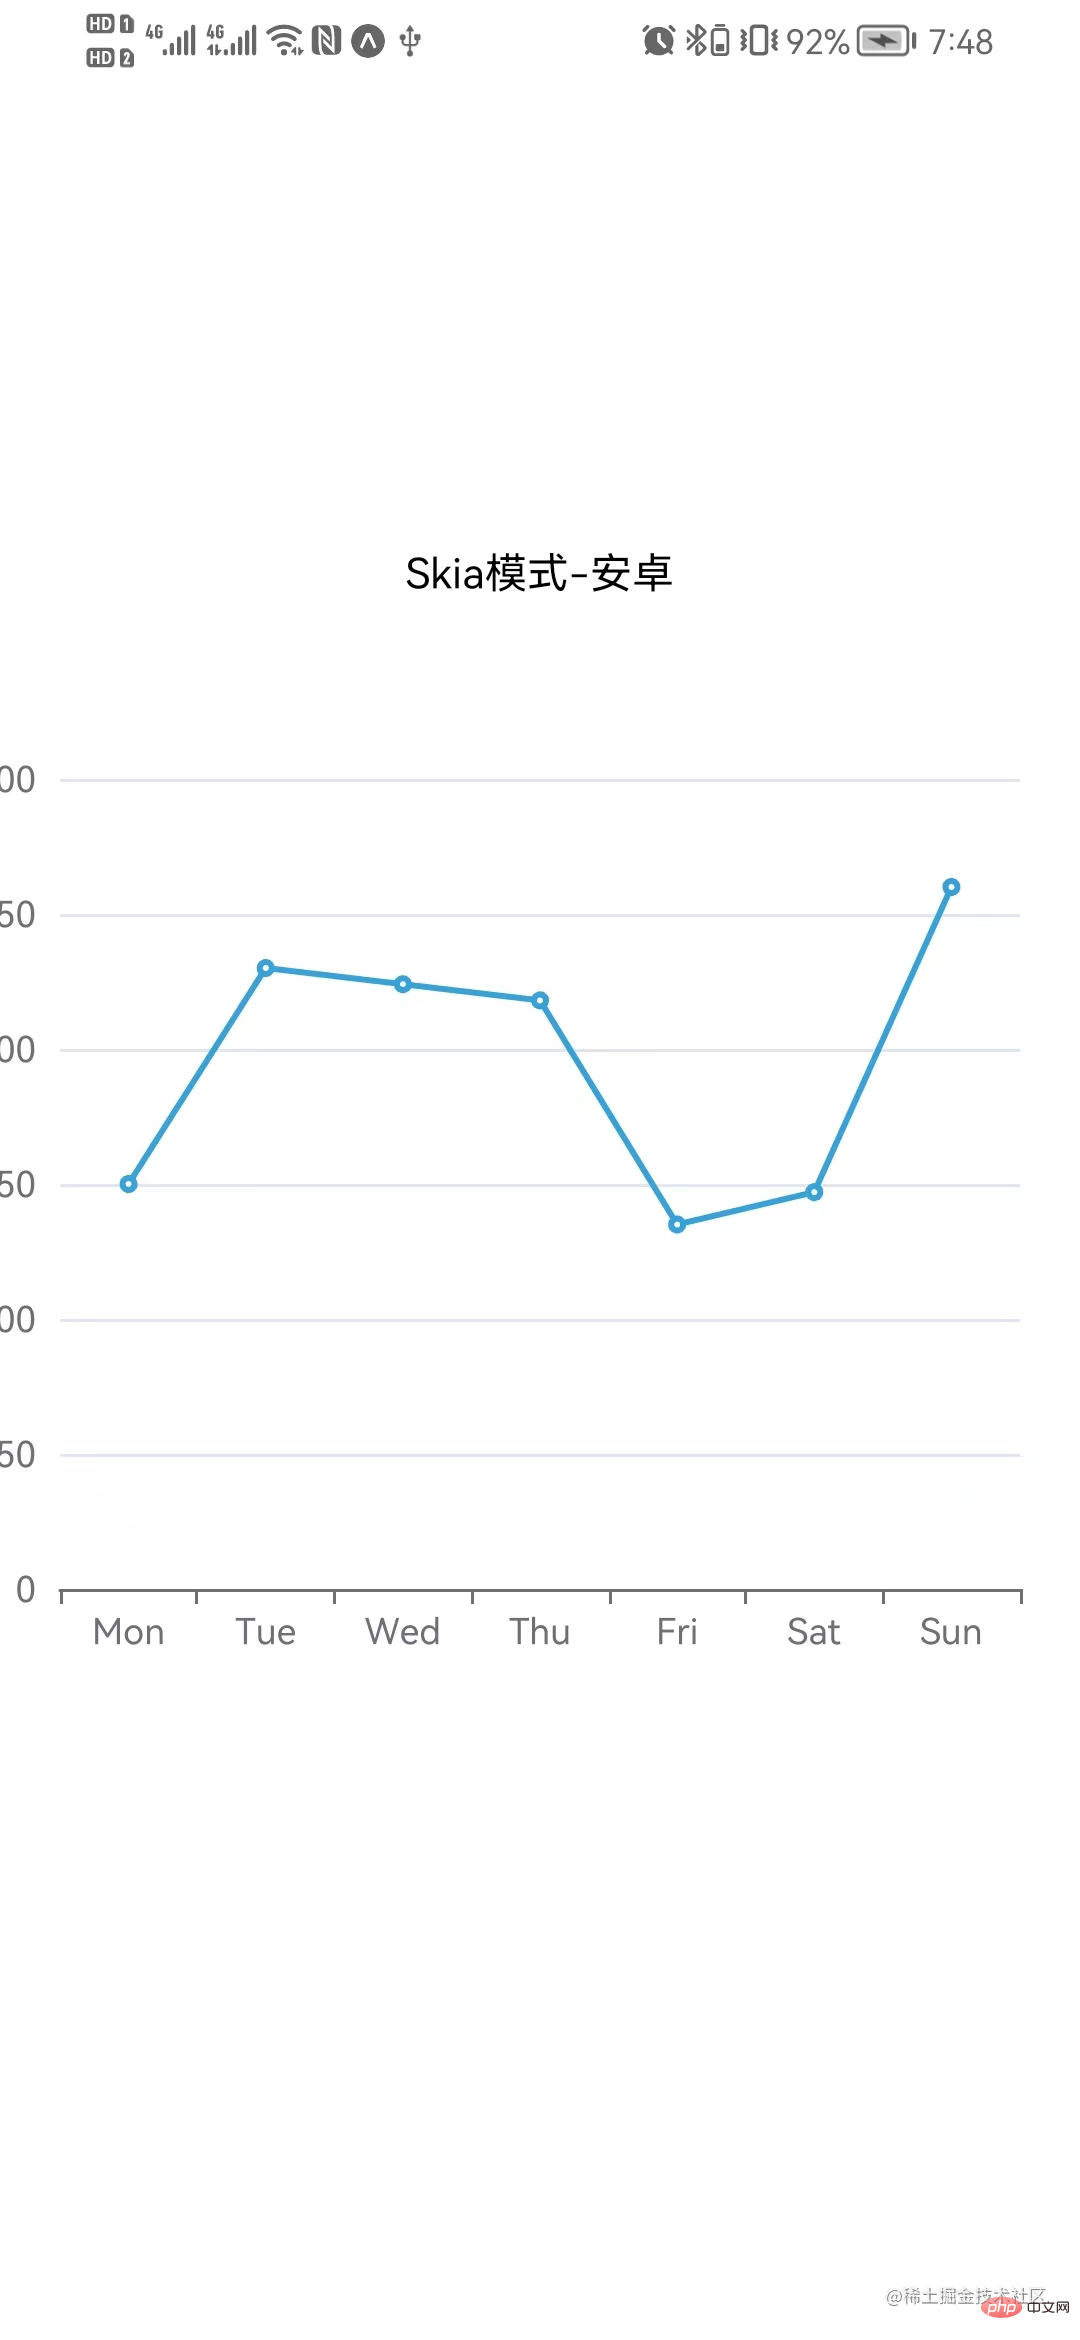 |
| iOS | Android |
|---|---|
 |  |
7、封装 Chart 组件
效果不错,不过每次使用都要把一堆东西引进去好烦,先简单封装下吧
import { useRef, useEffect } from 'react';
import * as echarts from 'echarts/core';
import { BarChart, LineChart, PieChart } from 'echarts/charts';
import {
  DataZoomComponent,
  GridComponent,
  LegendComponent,
  TitleComponent,
  ToolboxComponent,
  TooltipComponent,
} from 'echarts/components';
import {
  SVGRenderer,
  SvgChart as _SvgChart,
  SkiaChart as _SkiaChart,
} from '@wuba/react-native-echarts';
import { Dimensions } from 'react-native';

// 注册需要用到的组件
echarts.use([
  DataZoomComponent,
  SVGRenderer,
  BarChart,
  GridComponent,
  LegendComponent,
  ToolboxComponent,
  TooltipComponent,
  TitleComponent,
  PieChart,
  LineChart,
]);

// 图表默认宽高
const CHART_WIDTH = Dimensions.get('screen').width; // 默认用手机屏幕宽度
const CHART_HEIGHT = 300;

const Chart = ({
  option,
  onInit,
  width = CHART_WIDTH,
  height = CHART_HEIGHT,
  ChartComponent,
}) => {
  const chartRef = useRef(null);

  useEffect(() => {
    let chart;
    if (chartRef.current) {
      chart = echarts.init(chartRef.current, 'light', {
        renderer: 'svg',
        width,
        height,
      });
      option && chart.setOption(option);
      onInit?.(chart);
    }
    return () => chart?.dispose();
  }, [option]);
  return <ChartComponent ref={chartRef} />;
};

const SkiaChart = (props) => <Chart {...props} ChartComponent={_SkiaChart} />;
const SvgChart = (props) => <Chart {...props} ChartComponent={_SvgChart} />;
// 对外只暴露这哥俩就行
export { SkiaChart, SvgChart };8、多个图表使用
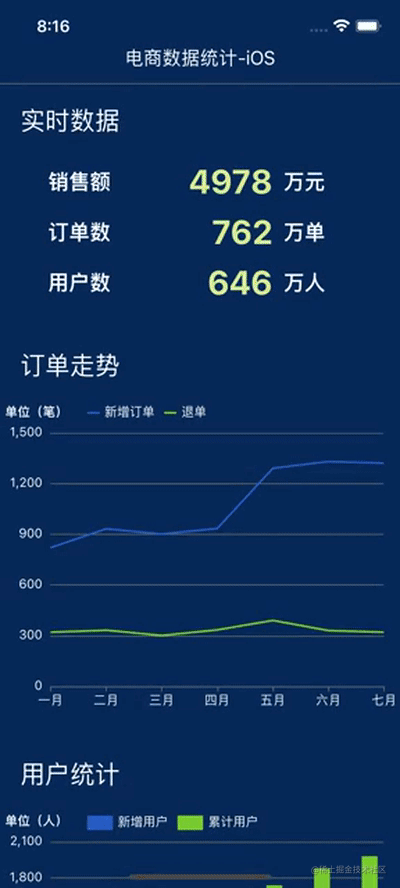
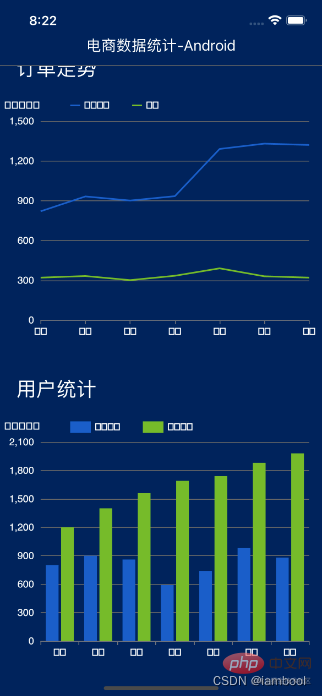
封装好了,咱就写个多图表同时使用的页面看看效果。这里写了个“电商数据分析”页面,分别有折线图、柱状图、饼图。下方是主要代码,用的 svg 模式,详细代码见这里。
// 页面代码
import { SkiaChart } from '../../components/Chart';
import { ScrollView, Text, View } from 'react-native';
import { StatusBar } from 'expo-status-bar';
import { useCallback, useEffect, useState } from 'react';
import {
defaultActual,
lineOption,
salesStatus,
salesVolume,
userAnaly,
getLineData,
} from './contants';
import styles from './styles';
// 开启图表loading
const showChartLoading = (chart) =>
chart.showLoading('default', {
maskColor: '#305d9e',
});
// 关闭图表loading
const hideChartLoading = (chart) => chart.hideLoading();
export default () => {
const [actual, setActual] = useState(defaultActual); // 记录实时数据
useEffect(() => {
// 假设循环请求数据
const interv = setInterval(() => {
const newActual = [];
for (let it of actual) {
newActual.push({
...it,
num: it.num + Math.floor((Math.random() * it.num) / 100),
});
}
setActual(newActual);
}, 200);
return () => clearInterval(interv);
}, [actual]);
const onInitLineChart = useCallback((myChart) => {
showChartLoading(myChart);
// 模拟数据请求
setTimeout(() => {
myChart.setOption({
series: getLineData,
});
hideChartLoading(myChart);
}, 1000);
}, []);
const onInitUserChart = useCallback((myChart) => {
// 模拟数据请求,跟onInitLineChart类似
}, []);
const onInitSaleChart = useCallback((myChart) => {
// 模拟数据请求,跟onInitLineChart类似
}, []);
const onInitStatusChart = useCallback((myChart) => {
// 模拟数据请求,跟onInitLineChart类似
}, []);
const chartList = [
['订单走势', lineOption, onInitLineChart],
['用户统计', userAnaly, onInitUserChart],
['各品类销售统计', salesVolume, onInitSaleChart],
['订单状态统计', salesStatus, onInitStatusChart],
];
return (
<ScrollView style={styles.index}>
<StatusBar style='light' />
<View>
<View style={styles.index_panel_header}>
<Text style={styles.index_panel_title}>实时数据</Text>
</View>
<View style={styles.index_panel_content}>
{actual.map(({ title, num, unit }) => (
<View key={title} style={styles.sale_item}>
<View style={styles.sale_item_cell}>
<Text style={styles.sale_item_text}>{title}</Text>
</View>
<View style={[styles.sale_item_cell, styles.num]}>
<Text style={styles.sale_item_num}>{num}</Text>
</View>
<View style={[styles.sale_item_cell, styles.unit]}>
<Text style={styles.sale_item_text}>{unit}</Text>
</View>
</View>
))}
</View>
</View>
{chartList.map(([title, data, callback]) => (
<View key={title}>
<View style={styles.index_panel_header}>
<Text style={styles.index_panel_title}>{title}</Text>
</View>
<View style={styles.index_panel_content}>
<SkiaChart option={data} onInit={callback} />
</View>
</View>
))}
</ScrollView>
);
};重新加载 bundle,看看效果图
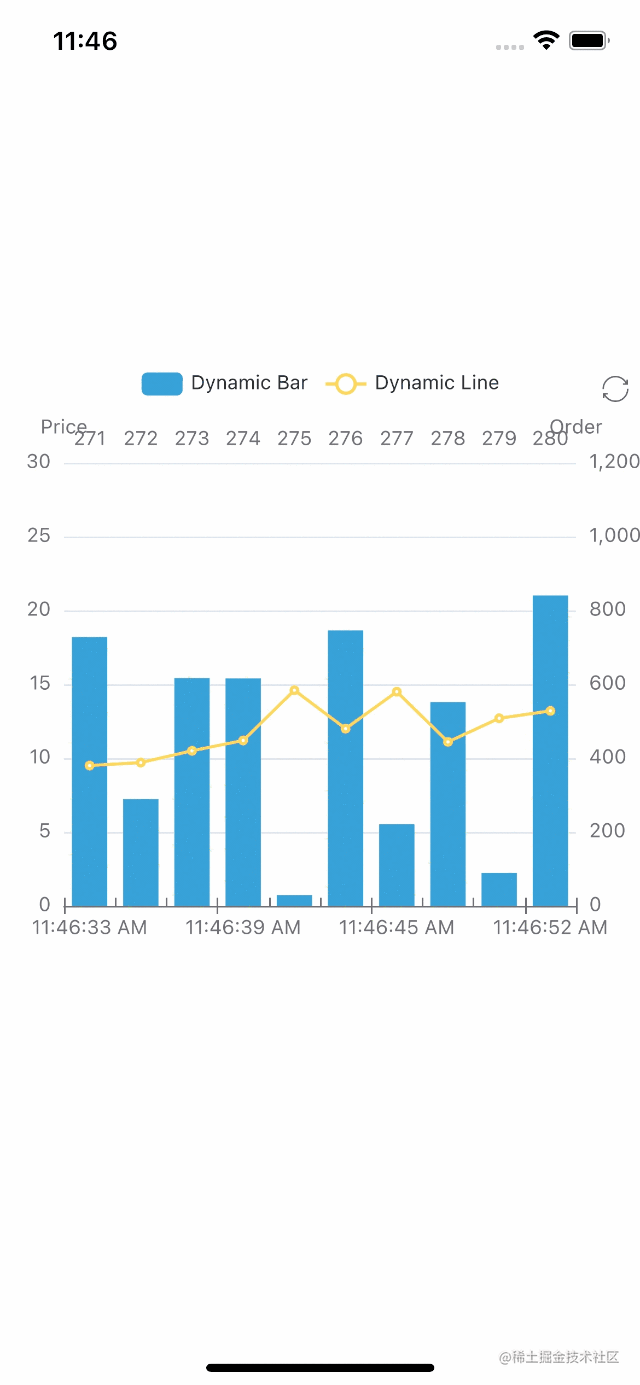
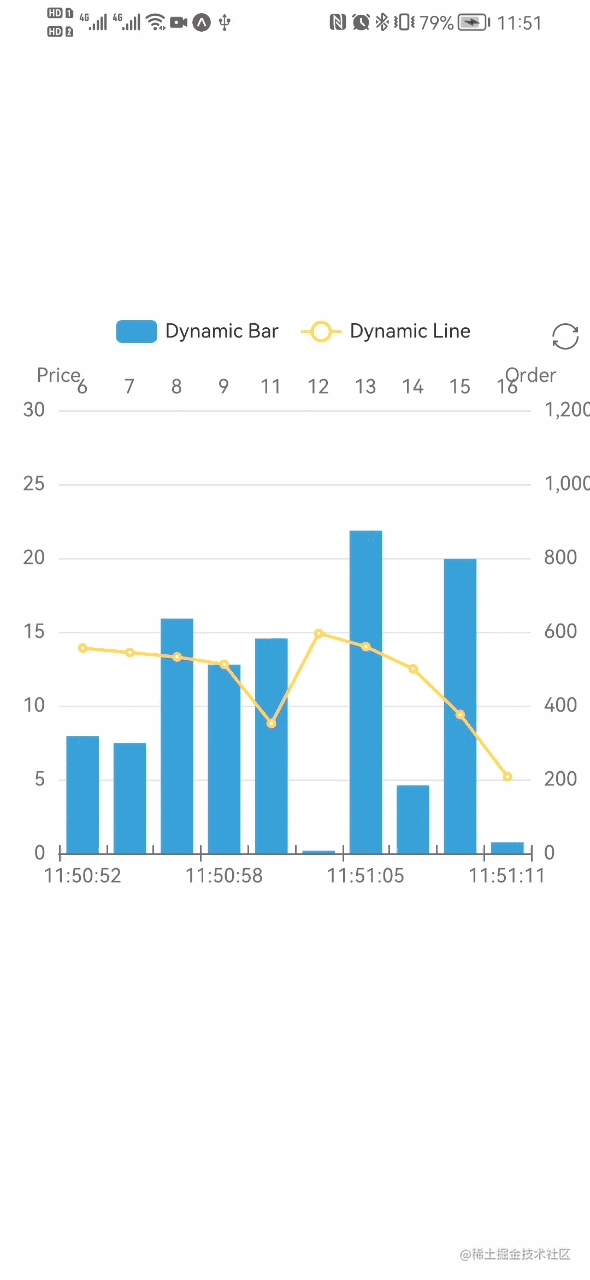
| iOS | Android |
|---|---|
 |
渲染出来后,iOS 上交互很丝滑,安卓上交互时感觉偶尔会有卡顿(不会是因为我手机太差吧…)。
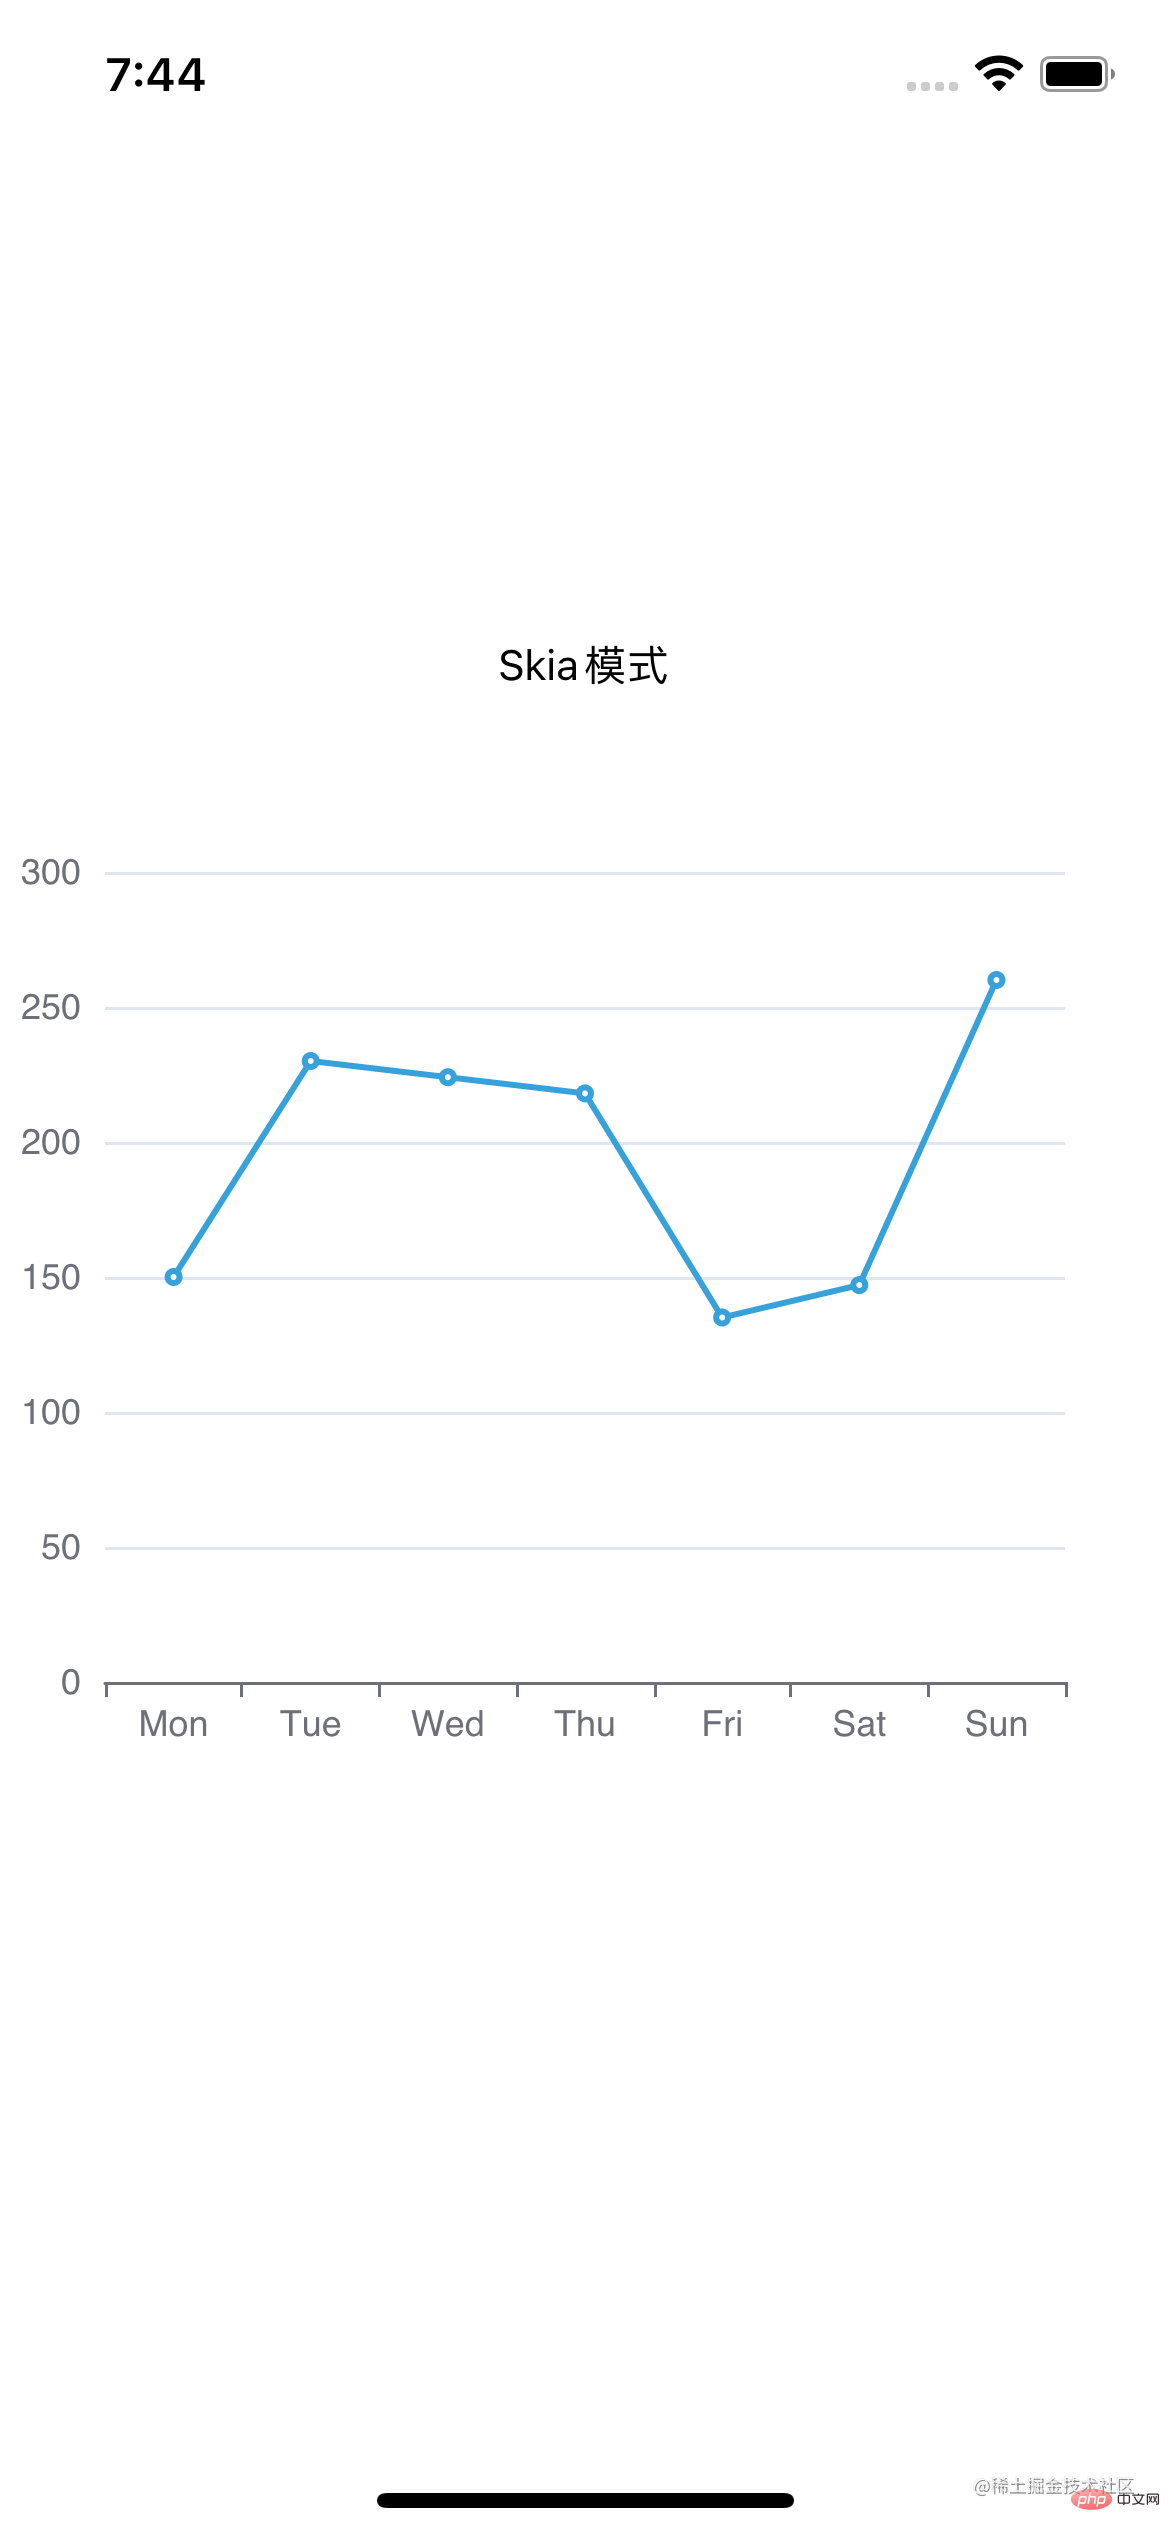
再换 Skia 模式看看
emmm 虽然可以,但是好像中文不能正常显示,安卓上中文都没有显示,iOS 则是乱码。看了下文档,目前 skia 在安卓端还不支持中文,在 iOS 端可以通过设置字体为 'PingFang SC'显示中文,比如:
const option = {
  title: {
    text: '我是中文',
    textStyle: {
      fontFamily: 'PingFang SC', // 指定字体类型
    },
  },
};但是每个显示中文的地方都要设置字体……那还是先用 svg 吧,我懒。
总结
使用了一段时间后,我总结了下:
- 支持度上,@wuba/react-native-echarts 除了 GL 系列、地图类图表还不支持外,其余类型的图表都支持,对于日常业务来说已经非常 enough 了。echarts 各种类型的图表实现,都可以在taro-playground上找到;
- 交互上,iOS 很丝滑,安卓有时会出现掉帧的情况;
- 性能上,还挺好的。
- 个人试了下,不是超大数据量就不会有什么问题,但是数据量太大的时候(比如画大数据量的热力图),渲染速度明显下降了很多,这是一个等待官方去优化的点。
- 另外页面内图表多的话,真机调试时加载速度会变慢,建议先用模拟器。
- 中文支持,Svg 模式支持中文,但 Skia 模式目前还不可以。
The above is the detailed content of Let's talk about how to use echarts to draw charts in React Native. For more information, please follow other related articles on the PHP Chinese website!

Hot AI Tools

Undresser.AI Undress
AI-powered app for creating realistic nude photos

AI Clothes Remover
Online AI tool for removing clothes from photos.

Undress AI Tool
Undress images for free

Clothoff.io
AI clothes remover

Video Face Swap
Swap faces in any video effortlessly with our completely free AI face swap tool!

Hot Article
Hot Tools

Notepad++7.3.1
Easy-to-use and free code editor

SublimeText3 Chinese version
Chinese version, very easy to use

Zend Studio 13.0.1
Powerful PHP integrated development environment

Dreamweaver CS6
Visual web development tools

SublimeText3 Mac version
God-level code editing software (SublimeText3)
Hot Topics
 1669
1669
 14
1428
52
1329
25
1273
29
1256
24
14
1428
52
1329
25
1273
29
1256
24

 ECharts and Java interface: How to quickly implement statistical charts such as line charts, bar charts, pie charts, etc.
Dec 17, 2023 pm 10:37 PM
ECharts and Java interface: How to quickly implement statistical charts such as line charts, bar charts, pie charts, etc.
Dec 17, 2023 pm 10:37 PM
ECharts and Java interface: How to quickly implement statistical charts such as line charts, bar charts, and pie charts. Specific code examples are required. With the advent of the Internet era, data analysis has become more and more important. Statistical charts are a very intuitive and powerful display method. Charts can display data more clearly, allowing people to better understand the connotation and patterns of the data. In Java development, we can use ECharts and Java interfaces to quickly display various statistical charts. ECharts is a software developed by Baidu
 How to use php interface and ECharts to generate visual statistical charts
Dec 18, 2023 am 11:39 AM
How to use php interface and ECharts to generate visual statistical charts
Dec 18, 2023 am 11:39 AM
In today's context where data visualization is becoming more and more important, many developers hope to use various tools to quickly generate various charts and reports so that they can better display data and help decision-makers make quick judgments. In this context, using the Php interface and ECharts library can help many developers quickly generate visual statistical charts. This article will introduce in detail how to use the Php interface and ECharts library to generate visual statistical charts. In the specific implementation, we will use MySQL
 Steps to draw dashboard using ECharts and Python interface
Dec 18, 2023 am 08:40 AM
Steps to draw dashboard using ECharts and Python interface
Dec 18, 2023 am 08:40 AM
The steps to draw a dashboard using ECharts and Python interface require specific code examples. Summary: ECharts is an excellent data visualization tool that can easily perform data processing and graphics drawing through the Python interface. This article will introduce the specific steps to draw a dashboard using ECharts and Python interface, and provide sample code. Keywords: ECharts, Python interface, dashboard, data visualization Introduction Dashboard is a commonly used form of data visualization, which uses
 How to use histogram to display data in ECharts
Dec 18, 2023 pm 02:21 PM
How to use histogram to display data in ECharts
Dec 18, 2023 pm 02:21 PM
How to use histograms to display data in ECharts ECharts is a JavaScript-based data visualization library that is very popular and widely used in the field of data visualization. Among them, the histogram is the most common and commonly used chart type, which can be used to display the size, comparison and trend analysis of various numerical data. This article will introduce how to use ECharts to draw histograms and provide code examples. First, we need to introduce the ECharts library into the HTML file, which can be introduced in the following way
 ECharts and golang technical guide: practical tips for creating various statistical charts
Dec 17, 2023 pm 09:56 PM
ECharts and golang technical guide: practical tips for creating various statistical charts
Dec 17, 2023 pm 09:56 PM
ECharts and golang technical guide: Practical tips for creating various statistical charts, specific code examples are required. Introduction: In the field of modern data visualization, statistical charts are an important tool for data analysis and visualization. ECharts is a powerful data visualization library, while golang is a fast, reliable and efficient programming language. This article will introduce you to how to use ECharts and golang to create various types of statistical charts, and provide code examples to help you master this skill. Preparation
 How to use map heat map to display city heat in ECharts
Dec 18, 2023 pm 04:00 PM
How to use map heat map to display city heat in ECharts
Dec 18, 2023 pm 04:00 PM
How to use a map heat map to display city heat in ECharts ECharts is a powerful visual chart library that provides various chart types for developers to use, including map heat maps. Map heat maps can be used to show the popularity of cities or regions, helping us quickly understand the popularity or density of different places. This article will introduce how to use the map heat map in ECharts to display city heat, and provide code examples for reference. First, we need a map file containing geographic information, EC
 How to use ECharts and php interface to generate statistical charts
Dec 18, 2023 pm 01:47 PM
How to use ECharts and php interface to generate statistical charts
Dec 18, 2023 pm 01:47 PM
How to use ECharts and PHP interfaces to generate statistical charts Introduction: In modern web application development, data visualization is a very important link, which can help us display and analyze data intuitively. ECharts is a powerful open source JavaScript chart library. It provides a variety of chart types and rich interactive functions, and can easily generate various statistical charts. This article will introduce how to use ECharts and PHP interfaces to generate statistical charts, and give specific code examples. 1. Overview of ECha
 Does ECharts depend on jQuery? In-depth analysis
Feb 27, 2024 am 08:39 AM
Does ECharts depend on jQuery? In-depth analysis
Feb 27, 2024 am 08:39 AM
Does ECharts need to rely on jQuery? Detailed interpretation requires specific code examples. ECharts is an excellent data visualization library that provides a rich range of chart types and interactive functions and is widely used in web development. When using ECharts, many people will have a question: Does ECharts need to rely on jQuery? This article will explain this in detail and give specific code examples. First, to be clear, ECharts itself does not rely on jQuery;
