
 Web Front-end
JS Tutorial
[Experience Summary] How to troubleshoot memory leaks in Node? Share ideas
Web Front-end
JS Tutorial
[Experience Summary] How to troubleshoot memory leaks in Node? Share ideas
[Experience Summary] How to troubleshoot memory leaks in Node? Share ideas

How to troubleshoot memory leaks in Node? The following article will summarize the Node memory leak troubleshooting experience for everyone. I hope it will be helpful to everyone!
![[Experience Summary] How to troubleshoot memory leaks in Node? Share ideas](https://img.php.cn/upload/article/000/000/024/63d505e3d0d7d931.jpg)
In the scenario of Nodejs server-side development, Memory leak is definitely the most troublesome problem;
But as long as the project continues to be developed and iterated, the problem of memory leak is absolutely inevitable, it just happens sooner or later. Therefore, systematically mastering effective memory leak troubleshooting methods is the most basic and core ability of a Nodejs engineer.
The difficulty in dealing with memory leaks is how to find out among countless functions and functions exactly which function and function in which line and line causes the memory leak.
Unfortunately, there are currently no tools on the market that can easily locate memory leaks, so many engineers who encounter this problem for the first time will feel confused and don't know how to deal with it.
Here I will share my handling ideas based on a case of investigating Memory Leak in 22 years.
Problem description
2022 Q4 One day, the R&D user group reported that our R&D platform could not be accessed, and a large number of exceptions occurred in the background. The task is not completed.
The first reaction is that there may be a memory leak. Fortunately, the service is connected to monitoring (prometheus grafana). In the grafana monitoring panel, it is found that the memory has been out of control since 10.00. There has been an apparent data leak. [Related tutorial recommendations: nodejs video tutorial]
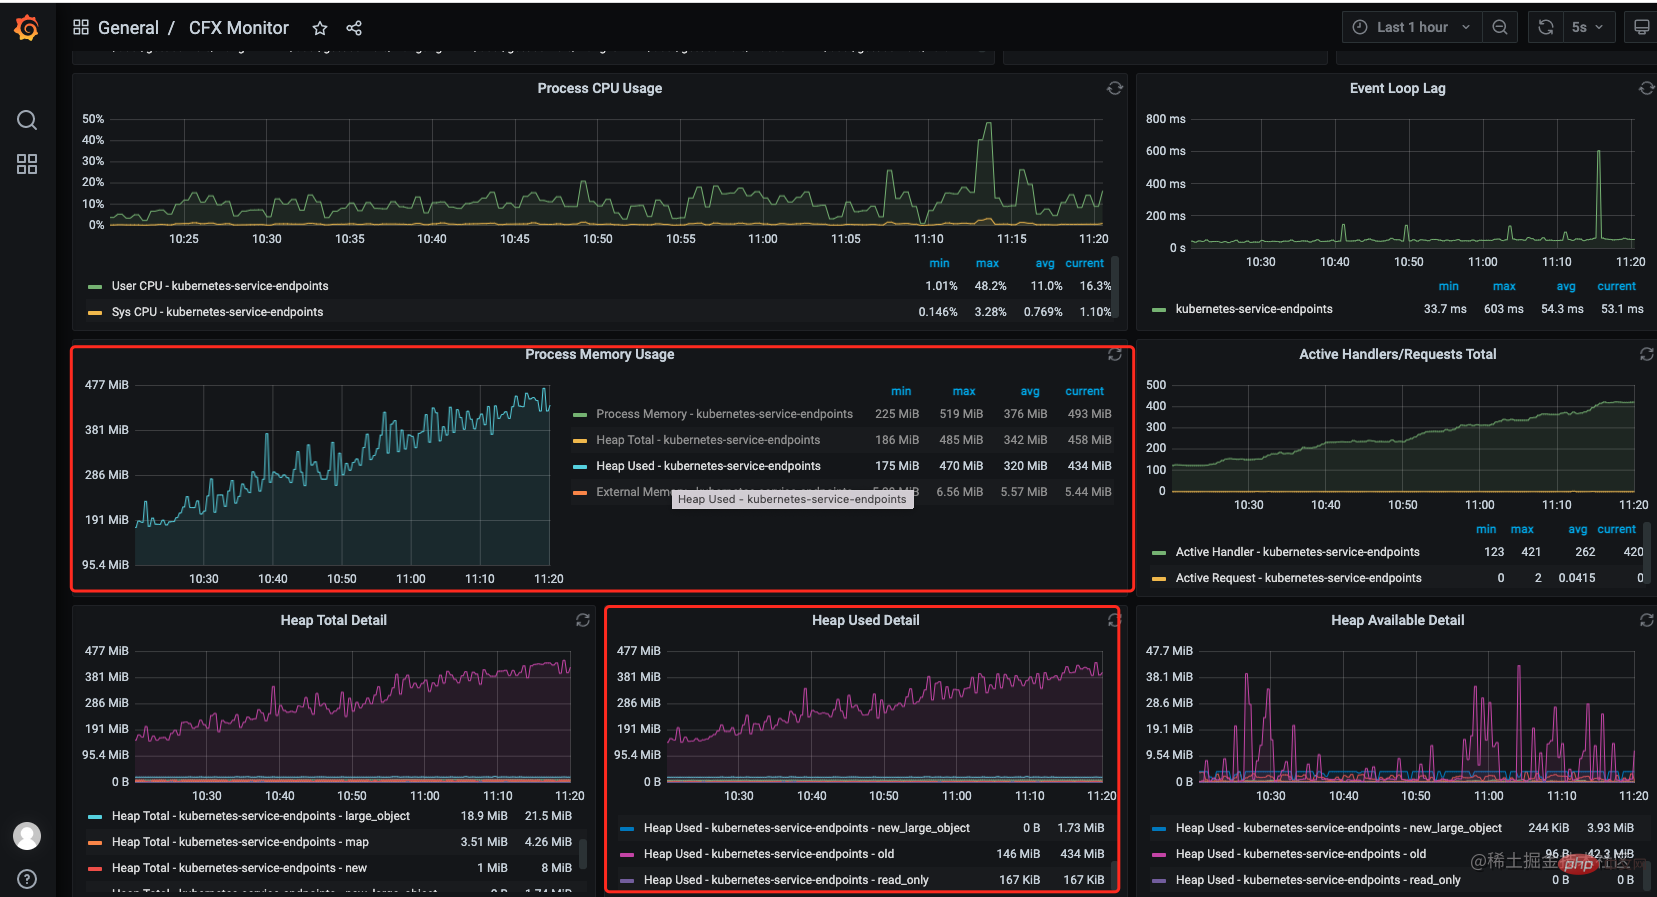
##Instructions:
You can call the global method
- process memory
:rss(Resident Set Size), the resident memory size of the process.- heapTotal
: The total size of the V8 heap.- heapUsed
: The size of the V8 heap used.- external
: V8 off-heap memory usage.process.memoryUsage()
inNodejsto obtain these data, among whichheapTotalandheapUsedis the usage of V8 heap, which is where JavaScript objects inNode.jsare stored. Andexternalrepresents memory allocated in non-V8 heap, such as C objects.rssis the total memory usage of the process. Generally, when looking at monitoring data, just focus on theheapUsedindicator.
Memory leak types
Memory leaks are mainly divided into:- Global leak
- Local leak
In fact, whether it is a global memory leak or a local memory leak, all you need to do is It is to narrow the scope of exclusion as much as possible.
Global memory leak
Global content leaks generally occur in:Middleware and components , this type of memory leak is also the easiest to troubleshoot.
2022 Q4 does not belong to this type, so I have to analyze it according to the idea of local leakage.
Dichotomy troubleshooting
I will not talk about other scientific analysis methods for this type. In this case, I think using the dichotomy method is the fastest.Process flow:
- Comment out half of the code first (reduce it by half
Middleware
,Component, or the use of other common logic) - Choose an interface or write a new test interface for stress testing
- If a memory leak occurs , then the leak point is in the currently used code. If there is no leak, the leak point will appear at
- and then keep repeating the above process for about 20 ~ 60 minutes. The memory leak can definitely be located. The detailed location of
In 2020, when I was working on an SSR application based onNuxt
, the stress test before going online found an application memory leak, which was determined to be global. After the unexpected leak, it took about 30 minutes to successfully locate the problem using the dichotomy method.The reason for the leak at that time was that we were using
axioson the server side. Later, we unifiedaxiosand replaced all related ones withnode-fetchand it was solved. Since then, I have switched toaxios PDSTand I will never useaxiosin theNodeservice.
Partial Troubleshooting of permanent memory leaks
Most memory leaks are local leaks. The leak point may exist with a certainmiddleware or a certain interface. In a certain asynchronous task, due to such characteristics, it is also more difficult to troubleshoot. In this case, heapdump will be done for analysis.
Here I mainly talk about my ideas in this case. I will put the detailed description of heapdump in the next paragraph,
Heap Dump: Heap dump , the following parts are all represented byheapdump, and there are many tools and tutorials for doingheapdump, such as: chrome, vscode, and the heapdump open source library. There are many online tutorials for the heapdump library I use, which I won’t go into here.
Local memory leak troubleshooting requires a certain amount of memory leak troubleshooting experience. Every time you encounter it, treat it as a test for yourself. After you accumulate more experience, you can troubleshoot memory leak problems later. It will get faster and faster.
1. Determine the time range when the memory leak occurs
This is very important. Knowing this can greatly narrow the scope of the investigation.
This situation often occurs. This iteration has three functions A, B, and C, and a memory leak occurs during the stress test or after going online. Then you can directly lock and small memory leaks will occur among these three new functions. In this case, there is no need to go to production to do heapdump We can easily analyze and locate the memory leak point locally through some tools.
Due to some special circumstances in our Q4 of 2020, when we found a memory leak, it was difficult to determine when the memory leak first appeared. We can only roughly lock it at 1 within months. This month we have gone through another major version iteration. If we check these functions and interfaces one by one, the cost will be very high.
Therefore, more data need to be combined for further analysis
2. Collect heapdump data
- When production starts
nodeAdd--expose-gc, this parameter will inject thegc()method globally to facilitate manual triggering of GC to obtain more accurateheap snapshotdata - Here I added two interfaces and brought my own exclusive permissions,
- Manually trigger GC
- Print heap snapshot
-
heapdump- The first time to print snapshot data after the project is started
- After the memory increases by 100M: trigger GC first, and then print the heap snapshot data for the second time
- The memory is close to critical Trigger GC again and then print the heap snapshot
Some points that need special attention when collecting heap snapshot data!
- The Node service will be interrupted during
heapdump. This time will be around 2 to 30 minutes depending on the size of the server memory at that time. Doingheapdumpin a production environment requires working with operation and maintenance to develop a reasonable strategy. I use two primary and secondarypodhere. When the primarypodis stopped, business requests will be load balanced to the secondarypodto ensure production. normal conduct of business. (This process must be a process closely coordinated with operation and maintenance. After all,heapdumpalso needs to get theheap snapshotfile in the server through them)- The above is close Printing a snapshot at the critical point is just a vague description. If you have tried it, you will know that if you wait very close to the critical point before printing a memory snapshot, it will not print out. So you need to control yourself to get close to this degree.
- Do it at least 3 times
heapdump(In fact, I did it 5 times to get the most detailed data)
3 . Combine the data from the monitoring panel for analysis
You need your application service to access monitoring. My application here uses prometheus grafana for monitoring, mainly Monitor the following indicators of the service
-
QPS(request visits per second), request status, and its access path -
ART( Average interface response time) and its access data -
NodeJsVersion -
Action Handlers(handle) -
Event Loop Lag(Event lag) - Number of service process restarts
- CPU usage
- Memory usage:
rss,heapTotal,heapUsed,external,heapAvailableDetail
##Onlyheapdump
data is not enough ,heapdumpThe data is very obscure, and even with the support of visualization tools, it is difficult to accurately locate the problem. At this time, I combined some data fromgrafanato look at it.
My analysis and processing results
Since the snapshot data at that time was lost, I will simulate the scene here. 1. Through thegrafana monitoring interface, I can see that the memory has been rising and not coming down, but at the same time, I also noticed that the number of handles in the service has also skyrocketed. It never falls off.
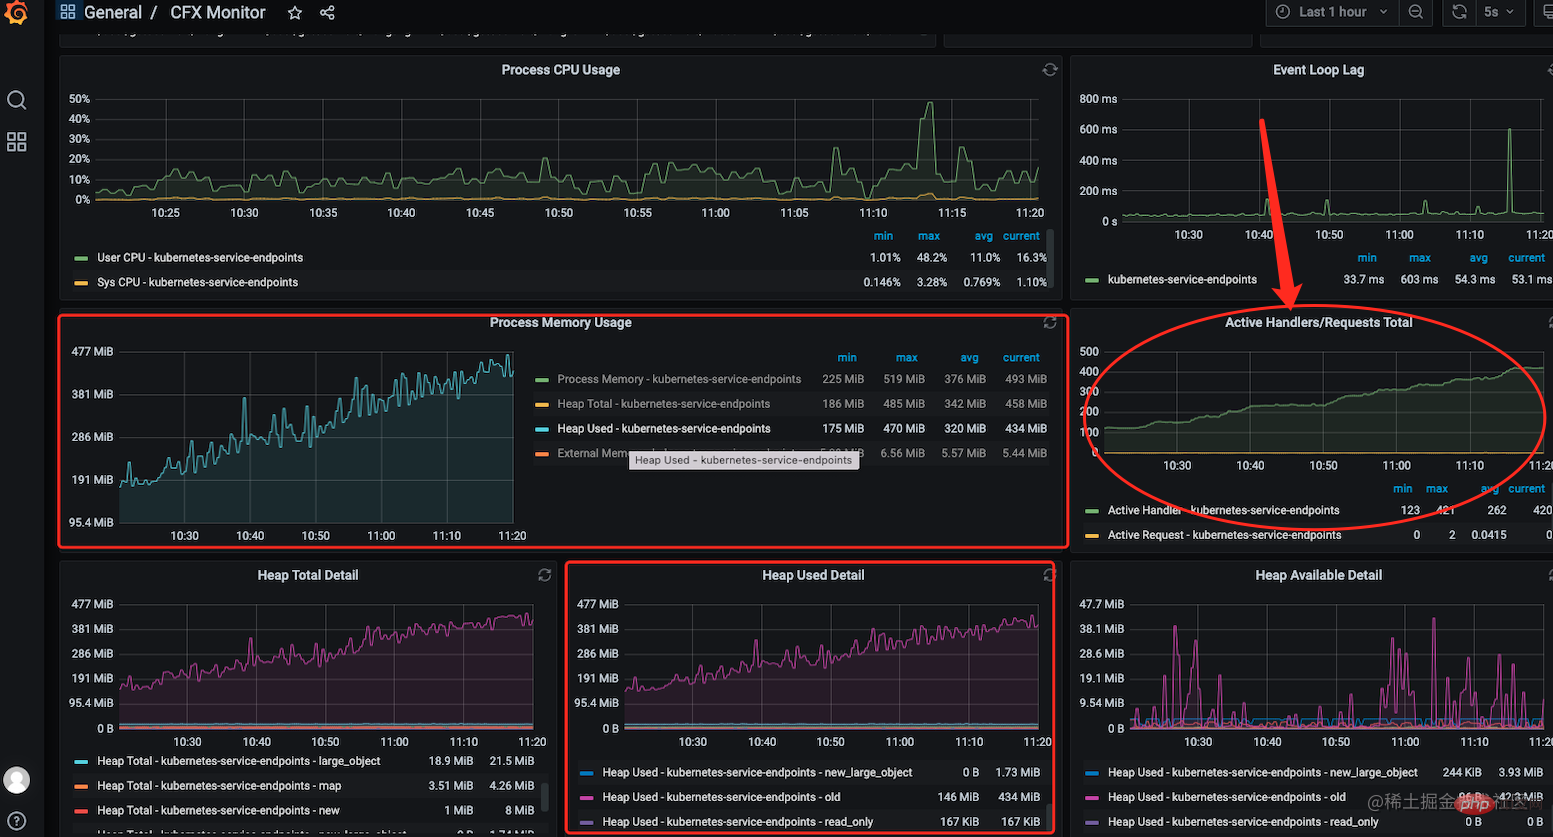
2. This is when I reviewed the new features in the month when the leak occurred and suspected that the memory leak might be caused by using the bull message queue component. I first analyzed the relevant application code, but I couldn't see that there was something wrong with it that caused a memory leak.
Combined with the handle leak problem in 1, it seems that you need to manually release certain resources after using bull. At this time, I am not sure about the specific reason.
3. Then the 5 times of heapdunmp data were analyzed, and the data was imported into chrome After comparing the 5 times of heap snapshots, it was found that after each queue creation, TCP , Socket, EventEmitter events are not released. At this point, it is basically certain that it is caused by the irregular use of bull. In bull, queues are usually not created frequently, and the system resources occupied by the queue are not automatically released. If necessary, they need to be released manually.
![[Experience Summary] How to troubleshoot memory leaks in Node? Share ideas](https://img.php.cn/upload/article/000/000/024/3ac32851609e14d3da1d33f80496eee4-2.png)
#4. After adjusting the code, the stress test was performed again and the problem was solved.
Tips: The
handlein Nodejs is a pointer that points to the underlying system resources (such as files, network connections, etc.). Handles allow Node.js programs to access and manipulate these resources without interacting directly with the underlying system. The handle can be an integer or an object, depending on the handle type used by the Node.js library or module. CommonHandle:
- ##fs.open()
Returned file handle- net.createServer()
The returned network server handle- dgram.createSocket()
The returned UDP socket handle- child_process.spawn()
The returned child process handle- crypto.createHash()
Returned hash handle- zlib.createGzip()
Returned compression handle
heapdump analysis summary
Usually many people are confused when they get theheap snapshotdata for the first time, and so am I. After reading countless analysis techniques on the Internet and combining them with my own actual practice, I have summarized some more useful techniques. Some basic usage tutorials will not be discussed here. Here we mainly talk about how to view the picture after the data is imported into chrome;
Summary view
When looking at this view, you will generally first select Retained Size, and then observe the size and number of objects. Experienced engineers can quickly determine that the number of certain objects is abnormal. In this view, in addition to caring about some objects defined by yourself,
Some objects prone to memory leaks also need attention, such as: ![[Experience Summary] How to troubleshoot memory leaks in Node? Share ideas](https://img.php.cn/upload/article/000/000/024/5ec58d2950a8a038af2e3794ac452eac-3.png)
- TCP
If passed
Summary view , If the problem cannot be located, we usually use the Comparison view. Through this view, we can compare the number of objects in the two heap snapshots and the changes in the memory occupied by the objects;
Through this information, we can judge the values of objects in the heap and memory changes after a period of time (certain operations). Through these values, we can find some abnormal objects. The name attributes or functions of these objects can narrow the scope of our memory leak investigation. Select two heap snapshots in the
view and compare between them. You can see which objects were added between two heap snapshots, which objects were reduced between two heap snapshots, and which objects changed in size. Comparison Views also allow viewing relationships between objects, as well as object details such as type, size and reference count. With this information, you can understand which objects are causing the memory leak.
![[Experience Summary] How to troubleshoot memory leaks in Node? Share ideas](https://img.php.cn/upload/article/000/000/024/2b53f8bd03c08e00f15929d1f42ae4da-4.png)
Displays all reachable reference relationships between objects. Each object is represented as a dot and connected to its parent object by a line. This way you can see the hierarchical relationships between objects and understand which objects are causing memory leaks.
![[Experience Summary] How to troubleshoot memory leaks in Node? Share ideas](https://img.php.cn/upload/article/000/000/024/fb8d54159c4bbba0c28af97d6b1eb853-5.png)
This picture is very simple and I won’t go into details
Memory leak scenario
- Global variables: Global variables will not be recycled
- Cache: Memory-intensive third-party libraries are used such as
lru-cacheStoring too much will result in insufficient memory. It is recommended to useredisinstead oflru-cache - in Nodejs service. Handle leakage: System resources are not released after calling
- Event monitoring
- Closure
- Circular reference
Summary
The service needs access monitoring to facilitate the first time determination of the problem type
Determine whether the memory leak is global or local
Use the dichotomy method to quickly troubleshoot and locate global memory leaks
-
Local memory leaks
- Determine the time when the memory leak occurs and quickly locate the problem Function
- Collect heap snapshot data, at least 3 times
- Combine monitoring data, heap snapshot data, and new functions at the time when the leak occurred to locate the memory leak point
Don’t be afraid when you encounter memory leak problems. Accumulate more experience in troubleshooting memory leak problems. The more experience you have in handling memory leak problems, the easier it will be to find them very quickly. After each solution, do a review and summary and look back again
Heap snapshotThe data is conducive to accumulating relevant experience faster
Others
- Stress testing tool: wrk
For more node-related knowledge, please visit: nodejs tutorial!
The above is the detailed content of [Experience Summary] How to troubleshoot memory leaks in Node? Share ideas. For more information, please follow other related articles on the PHP Chinese website!

Hot AI Tools

Undresser.AI Undress
AI-powered app for creating realistic nude photos

AI Clothes Remover
Online AI tool for removing clothes from photos.

Undress AI Tool
Undress images for free

Clothoff.io
AI clothes remover

Video Face Swap
Swap faces in any video effortlessly with our completely free AI face swap tool!

Hot Article
Hot Tools

Notepad++7.3.1
Easy-to-use and free code editor

SublimeText3 Chinese version
Chinese version, very easy to use

Zend Studio 13.0.1
Powerful PHP integrated development environment

Dreamweaver CS6
Visual web development tools

SublimeText3 Mac version
God-level code editing software (SublimeText3)
Hot Topics


 PHP and Vue: a perfect pairing of front-end development tools
Mar 16, 2024 pm 12:09 PM
PHP and Vue: a perfect pairing of front-end development tools
Mar 16, 2024 pm 12:09 PM
PHP and Vue: a perfect pairing of front-end development tools. In today's era of rapid development of the Internet, front-end development has become increasingly important. As users have higher and higher requirements for the experience of websites and applications, front-end developers need to use more efficient and flexible tools to create responsive and interactive interfaces. As two important technologies in the field of front-end development, PHP and Vue.js can be regarded as perfect tools when paired together. This article will explore the combination of PHP and Vue, as well as detailed code examples to help readers better understand and apply these two
 How to use Go language for front-end development?
Jun 10, 2023 pm 05:00 PM
How to use Go language for front-end development?
Jun 10, 2023 pm 05:00 PM
With the development of Internet technology, front-end development has become increasingly important. Especially the popularity of mobile devices requires front-end development technology that is efficient, stable, safe and easy to maintain. As a rapidly developing programming language, Go language has been used by more and more developers. So, is it feasible to use Go language for front-end development? Next, this article will explain in detail how to use Go language for front-end development. Let’s first take a look at why Go language is used for front-end development. Many people think that Go language is a
 C# development experience sharing: front-end and back-end collaborative development skills
Nov 23, 2023 am 10:13 AM
C# development experience sharing: front-end and back-end collaborative development skills
Nov 23, 2023 am 10:13 AM
As a C# developer, our development work usually includes front-end and back-end development. As technology develops and the complexity of projects increases, the collaborative development of front-end and back-end has become more and more important and complex. This article will share some front-end and back-end collaborative development techniques to help C# developers complete development work more efficiently. After determining the interface specifications, collaborative development of the front-end and back-end is inseparable from the interaction of API interfaces. To ensure the smooth progress of front-end and back-end collaborative development, the most important thing is to define good interface specifications. Interface specification involves the name of the interface
 Is Django front-end or back-end? check it out!
Jan 19, 2024 am 08:37 AM
Is Django front-end or back-end? check it out!
Jan 19, 2024 am 08:37 AM
Django is a web application framework written in Python that emphasizes rapid development and clean methods. Although Django is a web framework, to answer the question whether Django is a front-end or a back-end, you need to have a deep understanding of the concepts of front-end and back-end. The front end refers to the interface that users directly interact with, and the back end refers to server-side programs. They interact with data through the HTTP protocol. When the front-end and back-end are separated, the front-end and back-end programs can be developed independently to implement business logic and interactive effects respectively, and data exchange.
 Exploring Go language front-end technology: a new vision for front-end development
Mar 28, 2024 pm 01:06 PM
Exploring Go language front-end technology: a new vision for front-end development
Mar 28, 2024 pm 01:06 PM
As a fast and efficient programming language, Go language is widely popular in the field of back-end development. However, few people associate Go language with front-end development. In fact, using Go language for front-end development can not only improve efficiency, but also bring new horizons to developers. This article will explore the possibility of using the Go language for front-end development and provide specific code examples to help readers better understand this area. In traditional front-end development, JavaScript, HTML, and CSS are often used to build user interfaces
 How to implement instant messaging on the front end
Oct 09, 2023 pm 02:47 PM
How to implement instant messaging on the front end
Oct 09, 2023 pm 02:47 PM
Methods for implementing instant messaging include WebSocket, Long Polling, Server-Sent Events, WebRTC, etc. Detailed introduction: 1. WebSocket, which can establish a persistent connection between the client and the server to achieve real-time two-way communication. The front end can use the WebSocket API to create a WebSocket connection and achieve instant messaging by sending and receiving messages; 2. Long Polling, a technology that simulates real-time communication, etc.
 Questions frequently asked by front-end interviewers
Mar 19, 2024 pm 02:24 PM
Questions frequently asked by front-end interviewers
Mar 19, 2024 pm 02:24 PM
In front-end development interviews, common questions cover a wide range of topics, including HTML/CSS basics, JavaScript basics, frameworks and libraries, project experience, algorithms and data structures, performance optimization, cross-domain requests, front-end engineering, design patterns, and new technologies and trends. . Interviewer questions are designed to assess the candidate's technical skills, project experience, and understanding of industry trends. Therefore, candidates should be fully prepared in these areas to demonstrate their abilities and expertise.
 Django: A magical framework that can handle both front-end and back-end development!
Jan 19, 2024 am 08:52 AM
Django: A magical framework that can handle both front-end and back-end development!
Jan 19, 2024 am 08:52 AM
Django: A magical framework that can handle both front-end and back-end development! Django is an efficient and scalable web application framework. It is able to support multiple web development models, including MVC and MTV, and can easily develop high-quality web applications. Django not only supports back-end development, but can also quickly build front-end interfaces and achieve flexible view display through template language. Django combines front-end development and back-end development into a seamless integration, so developers don’t have to specialize in learning
