

Example analysis of usage records of pt-query-digest tool in MySQL

This article brings you relevant knowledge about mysql. It mainly introduces a tool pt-query-digest for analyzing mysql slow query logs. Let’s take a look at it together. I hope it will be helpful to everyone.
1. Introduction
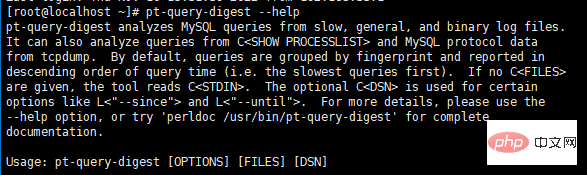
pt-query-digest is a tool used to analyze mysql slow query logs. It can also analyze queries from "SHOW PROCESSLIST" and MySQL Protocol data in tcpdump. We can output the analysis log to a specified file and perform corresponding optimization and other operations by analyzing the log file.
2. Download and install
- Install according to different systems. My system is centos, so I directly choose centos installation, Click to download
- Use yum to install directly
> wget https://downloads.percona.com/downloads/percona-toolkit/3.4.0/binary/redhat/7/x86_64/percona-toolkit-3.4.0-3.el7.x86_64.rpm
> yum install percona-toolkit-3.4.0-3.el7.x86_64.rpm
- Or use the source code package to compile and install
> wget https://downloads.percona.com/downloads/percona-toolkit/3.4.0/source/debian/percona-toolkit-3.4.0.tar.gz
> tar -zxvf percona-toolkit-3.4.0.tar.gz
> cd percona-toolkit-3.4.0
> perl Makefile.PL PREFIX=/usr/local/percona-toolkit
> make && make install
3. Installation completed
##4. Analysis of msql’s slow query log
- pt-query-digest The parameters can be viewed using the perldoc command
- –since: indicates the start time–until: Indicates the end time
Analyze the slow log and save the analysis results to the mysql data table - –user: Database user name –password: database passwordh: database hostD: database namet: generated table name
perldoc /usr/bin/pt-query-digest
pt-query-digest mysql-slow.log > slow_report.log
pt-query-digest mysql-slow.log --since '2022-10-01 00:00:00' --until '2022-11-05 00:00:00' > slow_report_date_20221021-202221105.log
pt-query-digest --user=root --password=123456 --history
h=192.168.33.10,D=local_test_db,t=query_review --create-history-table  mysql-slow.log  --since
'2022-11-01 00:00:00' --until '2022-11-05 00:00:00'
5. Result Analysis
Part 1: General analysis overview- Overall: How many queries are there in total
- Time range: The time range of query execution
- unique: The number of unique queries, that is, how many different queries there are after parameterizing the query conditions
- total: Total duration of all queries
- min: Minimum duration of all queries
- max: All Maximum query duration
- avg: Average query duration
- 95%: Arrange all duration values from small to large, and the position is at 95% That duration number, this number generally has the most reference value
- median: Median, arranges all duration values from small to large, and the duration number located in the middle
# A software update is available:

# 23.7s user time, 15.8s system time, 35.67M rss, 249.01M vsz
说明:
执行过程中,在用户中所花费的所有时间
执行过程中,在内核空间中所花费的所有时间
pt-query-digest 进程所分配的内存大小
pt-query-digest 进程所分配的虚拟内存大小

# Current date: Mon Nov  7 09:01:23 2022
说明:当前时间
# Hostname: localhost.localdomain
说明:执行pt-query-digest的主机名
# Files: mysql-slow.log
说明:被分析的文件名称
# Overall: 44.78k total, 54 unique, 0.01 QPS, 0.07x concurrency __________
说明:
total: 语句总数量
unique: 唯一语句数量
QPS: 每秒查询量
concurrency: 查询的并发

# Time range: 2022-10-01 00:00:03 to 2022-11-04 16:05:24
说明:执行过程中日志记录的时间范围
# Attribute          total     min     max     avg     95%  stddev  median
说明:属性            总计      最小值   最大值  平均值   95%  标准差   中位数
95%: 把所有时长值从小到大排列,位置位于 95% 的那个时长数,这个数一般最具有参考价值
median: 中位数,把所有时长值从小到大排列,位置位于中间那个时长数

# ============     ======= ======= ======= ======= ======= ======= =======
# Exec time        204553s      3s   1540s      5s     10s      8s      3s
说明:执行时间
# Lock time             8s       0   107ms   186us    80us     2ms    36us
说明:锁占用时间
# Rows sent        238.87M       0   2.88M   5.46k   11.95  68.22k    0.99
说明:发送到客户端的行数
# Rows examine      73.56G       0   5.01M   1.68M   3.86M 724.49k   1.32M
说明:扫描的语句行数
# Query size         8.18M      30   4.36k  191.46  511.45  224.63   72.65
说明:查询的字符数
- Rank: Ranking of all statements, by default arranged in descending order of query time, specified by –order-by
- –order-by Query_time:sum: Sort by total query time in reverse order
- Sort parameter introduction:
sum Sum/total attribute value (default value)
min Minimum attribute value (minimum value)
max Maximum attribute value (minimum value)
cnt Frequency/count of the query (by the number of times sql appears)
- Sort parameter introduction:
- Query ID: statement ID (remove extra spaces and text characters, calculate hash value)
- Response: Total response time
- time: The query is in this The total time proportion in this analysis
- Calls: the number of executions, that is, the total number of query statements of this type in this analysis
- R/Call: Average response time per execution
- V/M: Ratio of response time Variance-to-mean
- Item : Query object
# Profile
说明:分析
# Rank Query ID                            Response time    Calls R/Call
# ==== =================================== ================ ===== =======
#    1 0xC000AA97F210B2AEAE4933AF9B00296A  104236.2061 5... 30988  3.3638  0.03 SELECT xxx
#    2 0x974C6E6D54DB8B0DF505CA7BDC508686  32167.9607 15.7%  3418  9.4113  1.34 SELECT xxx
#    3 0x6BE180C5804B585F25BB16550447DC6C  18453.0185  9.0%  2499  7.3842  0.92 SELECT xxx
#    4 0xADF16E3E9EB5D6B08245E39FF1428C9F  17873.4338  8.7%  3114  5.7397  0.84 SELECT xxx
#    5 0x2964CD629A24595719659BDAEBCF0E6F  10648.5404  5.2%  1437  7.4103  0.93 SELECT xxx
#    6 0x50566E6DCF8FA562B88AE41AB1E32DC6   7424.3855  3.6%   303 24.5029 15.41 SELECT xxx
#    7 0xDB0A3D60F85C2212C476B144E1678AB8   5327.8370  2.6%  1627  3.2746  0.05 SELECT xxx
#    8 0x04BB0B332CEED517298AB06DE2A30AD6   3190.6822  1.6%   657  4.8564  1.36 SELECT xxx
#   10 0xDAB0AF524151C621DC0E9B92AC002C38    526.6288  0.3%   140  3.7616  0.01 SELECT xxx
# MISC 0xMISC                               1807.1067  0.9%    57 31.7036   0.0 <27 ITEMS>
- pct: A certain execution attribute of this SQL statement accounts for all slow queries Percentage of an execution attribute of the statement
- total: All attribute times of an execution attribute of the SQL statement.
- Count: The number of times the sql statement is executed. The corresponding pct indicates that the number of execution times of this SQL statement accounts for the % of the number of execution times of all slow query statements (69% in the figure below), and the corresponding total indicates that a total of 30988 times were executed.
- Exec time: sql execution time
- Lock time: The time when sql is locked during execution
- Rows sent: The valid data transmitted has a value only in the select query statement
- Rows examine: The total queried data, non-target data.
- Query_time distribution: Query time distribution
- SQL statement: The picture below is select sleep(7)\G
# Query 1: 0.01 QPS, 0.03x concurrency, ID 0xC000AA97F210B2AEAE4933AF9B00296A at byte 221452362
说明:查询队列1:每秒查询量,查询的并发,队列1的ID值,对应第二部分的Query ID, 221452362表示偏移量(查看方法看下面的“查看偏移”)
# This item is included in the report because it matches --limit.
# Scores: V/M = 0.03
# Time range: 2022-10-01 00:00:05 to 2022-11-04 16:05:24
说明:sql语句在慢日志文件mysql_slow.log出现的时间范围
# Attribute    pct   total     min     max     avg     95%  stddev  median
说明:属性      占整个 总数      最小值  最大值   平均值  95%   标准差  中间值
           分析中
           的百分
           比
# ============ === ======= ======= ======= ======= ======= ======= =======
# Count         69   30988
说明:执行语句总数量
# Exec time     50 104236s      3s      7s      3s      4s   303ms      3s
说明:执行时间
# Lock time     24      2s    22us    93ms    65us    66us   775us    38us
说明:锁占用时间
# Rows sent      0  70.53k       0     799    2.33    3.89   16.60    0.99
说明:发送到客户端的行数
# Rows examine  54  40.28G   1.32M   1.35M   1.33M   1.32M  15.65k   1.32M
说明:扫描语句的行数
# Query size    26   2.16M      73      73      73      73       0      73
说明:查询的字符数
# String:
# Hosts        localhost
说明:使用的数据主机IP
# Users        xxx
说明:使用的用户
# Query_time distribution
#   1us
#  10us
# 100us
#   1ms
#  10ms
# 100ms
#    1s  ################################################################
#  10s+
说明:查询时间分布
# Tables
#    SHOW TABLE STATUS LIKE 'xxx'\G
#    SHOW CREATE TABLE `xxx`\G
# EXPLAIN /*!50100 PARTITIONS*/
select * from `table_name` where `updated_at` >= '2022-10-15 00:00:40'\G
说明:查询的mysql语句
第三部分是每一种查询比较慢的 sql 的详细统计结果
pct:该 sql 语句某执行属性占所有慢查询语句某执行属性的百分比
total:该 sql 语句某执行属性的所有属性时间。
Count:sql 语句执行的次数。
Exec time:sql 执行时间
Lock time:sql 执行期间被Six View Offset
- You can use the offset to find the specific SQL statement in the slow query log file. The search method is as follows:
[localhost]# tail -c +221452362 ./mysql-slow.log | head
t: root[root] @ localhost []  Id: 13704150
# Query_time: 7.058835  Lock_time: 0.000040 Rows_sent: 2  Rows_examined: 1392521
SET timestamp=1665763267;
select * from `xxxxxx` where `updated_at` >= '2022-10-15 00:00:40';
# User@Host: root[localhost] @ localhost []  Id: 13704174
# Query_time: 7.445741  Lock_time: 0.000015 Rows_sent: 3  Rows_examined: 2214002
SET timestamp=1665763267;
select xxx from table where xxx
# Time: 221015 008
# User@Host: root[localhost] @ localhost []  Id: 13704414
The above is the detailed content of Example analysis of usage records of pt-query-digest tool in MySQL. For more information, please follow other related articles on the PHP Chinese website!

Hot AI Tools

Undresser.AI Undress
AI-powered app for creating realistic nude photos

AI Clothes Remover
Online AI tool for removing clothes from photos.

Undress AI Tool
Undress images for free

Clothoff.io
AI clothes remover

Video Face Swap
Swap faces in any video effortlessly with our completely free AI face swap tool!

Hot Article
Hot Tools

Notepad++7.3.1
Easy-to-use and free code editor

SublimeText3 Chinese version
Chinese version, very easy to use

Zend Studio 13.0.1
Powerful PHP integrated development environment

Dreamweaver CS6
Visual web development tools

SublimeText3 Mac version
God-level code editing software (SublimeText3)
Hot Topics


 MySQL's Role: Databases in Web Applications
Apr 17, 2025 am 12:23 AM
MySQL's Role: Databases in Web Applications
Apr 17, 2025 am 12:23 AM
The main role of MySQL in web applications is to store and manage data. 1.MySQL efficiently processes user information, product catalogs, transaction records and other data. 2. Through SQL query, developers can extract information from the database to generate dynamic content. 3.MySQL works based on the client-server model to ensure acceptable query speed.
 How to start mysql by docker
Apr 15, 2025 pm 12:09 PM
How to start mysql by docker
Apr 15, 2025 pm 12:09 PM
The process of starting MySQL in Docker consists of the following steps: Pull the MySQL image to create and start the container, set the root user password, and map the port verification connection Create the database and the user grants all permissions to the database
 Laravel Introduction Example
Apr 18, 2025 pm 12:45 PM
Laravel Introduction Example
Apr 18, 2025 pm 12:45 PM
Laravel is a PHP framework for easy building of web applications. It provides a range of powerful features including: Installation: Install the Laravel CLI globally with Composer and create applications in the project directory. Routing: Define the relationship between the URL and the handler in routes/web.php. View: Create a view in resources/views to render the application's interface. Database Integration: Provides out-of-the-box integration with databases such as MySQL and uses migration to create and modify tables. Model and Controller: The model represents the database entity and the controller processes HTTP requests.
 Solve database connection problem: a practical case of using minii/db library
Apr 18, 2025 am 07:09 AM
Solve database connection problem: a practical case of using minii/db library
Apr 18, 2025 am 07:09 AM
I encountered a tricky problem when developing a small application: the need to quickly integrate a lightweight database operation library. After trying multiple libraries, I found that they either have too much functionality or are not very compatible. Eventually, I found minii/db, a simplified version based on Yii2 that solved my problem perfectly.
 How to install mysql in centos7
Apr 14, 2025 pm 08:30 PM
How to install mysql in centos7
Apr 14, 2025 pm 08:30 PM
The key to installing MySQL elegantly is to add the official MySQL repository. The specific steps are as follows: Download the MySQL official GPG key to prevent phishing attacks. Add MySQL repository file: rpm -Uvh https://dev.mysql.com/get/mysql80-community-release-el7-3.noarch.rpm Update yum repository cache: yum update installation MySQL: yum install mysql-server startup MySQL service: systemctl start mysqld set up booting
 Centos install mysql
Apr 14, 2025 pm 08:09 PM
Centos install mysql
Apr 14, 2025 pm 08:09 PM
Installing MySQL on CentOS involves the following steps: Adding the appropriate MySQL yum source. Execute the yum install mysql-server command to install the MySQL server. Use the mysql_secure_installation command to make security settings, such as setting the root user password. Customize the MySQL configuration file as needed. Tune MySQL parameters and optimize databases for performance.
 Laravel framework installation method
Apr 18, 2025 pm 12:54 PM
Laravel framework installation method
Apr 18, 2025 pm 12:54 PM
Article summary: This article provides detailed step-by-step instructions to guide readers on how to easily install the Laravel framework. Laravel is a powerful PHP framework that speeds up the development process of web applications. This tutorial covers the installation process from system requirements to configuring databases and setting up routing. By following these steps, readers can quickly and efficiently lay a solid foundation for their Laravel project.
 MySQL vs. Other Programming Languages: A Comparison
Apr 19, 2025 am 12:22 AM
MySQL vs. Other Programming Languages: A Comparison
Apr 19, 2025 am 12:22 AM
Compared with other programming languages, MySQL is mainly used to store and manage data, while other languages such as Python, Java, and C are used for logical processing and application development. MySQL is known for its high performance, scalability and cross-platform support, suitable for data management needs, while other languages have advantages in their respective fields such as data analytics, enterprise applications, and system programming.
