Scout APM 是 Laravel 应用程序性能监控工具,可将性能异常直接绑定到端点,从而节省开发人员花费在故障排除和调试上的数小时时间。
Scout 最近扩展了其服务产品,包括针对 PHP 应用程序的微服务和托管服务监控,为您提供更具凝聚力和可操作性的可观察性指标。通过阅读以下内容,了解有关如何使用 Scout APM 监控 Laravel 应用程序的更多信息。
要开始监控您的 Laravel 应用程序,您首先需要一个 Scout 帐户。如果您还没有,可以 在此处注册 14 天免费试用(无需信用卡)。
接下来要做的是将低开销的监控代理添加到项目的依赖中,这可以通过在 shell 中使用一个命令来完成:
composer require scoutapp/scout-apm-laravel
此命令将安装两个包:scout-apm-laravel 和 scout-apm-php。下一步是定义一些配置以代理链接到您的账户。为此,请在您的文本编辑器中打开项目的 .env 文件,并将以下三行配置添加到文件中:
SCOUT_MONITOR=true
SCOUT_KEY=”enter your Agent Key here”
SCOUT_NAME=”enter the name of you application here”
您可以在 Scout 的设置页面 上找到您账户的代理秘钥。部署,大约 5 分钟后,您的数据将开始出现在 Scout 中。 有关 Heroku 安装或解决安装问题的更多信息,请查看文档或发送电子邮件至 support@scoutapm.com,我们将很乐意提供帮助。
现在你已经创建了一个 Scout 帐户,连接了监控代理,但是你从哪里开始诊断你的应用程序的性能问题呢?让我们看一下 Scout 的主要功能,这些功能可以帮助您快速了解性能问题。
当您登录 Scout 时,您看到的第一个页面是概览页面(如下所示),它为您提供了一个清晰、整洁的应用程序运行状况和性能快照,一目了然。
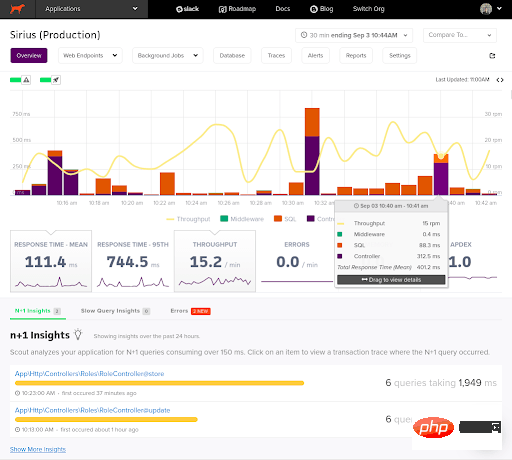
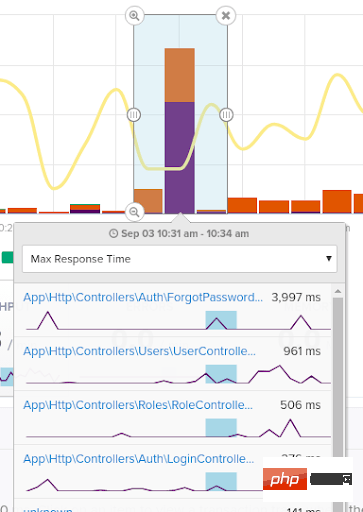
该图表是高度可配置的,允许您更改时间段并切换您想要查看的指标。它还具有一个简洁的拖放工具(如下所示),可让您在希望更详细地探索的区域周围绘制一个框。当您绘制这些框时,将动态加载一个弹出窗口,显示在此时间段内访问的所有端点。当您在图表上看到性能峰值并且想要了解其原因时,此功能尤其有用。
如果您是第一次尝试 Scout,一个很好的起点是洞察选项卡。在这里,我们有一组算法可以分析您的项目以识别潜在的 n+1 查询 和 慢查询。这些为您提供了「唾手可得的」性能修复,通常可以立即提高应用程序的性能。
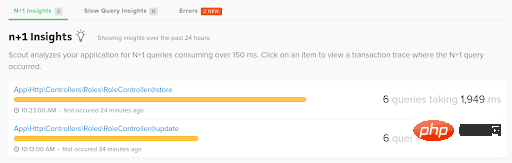
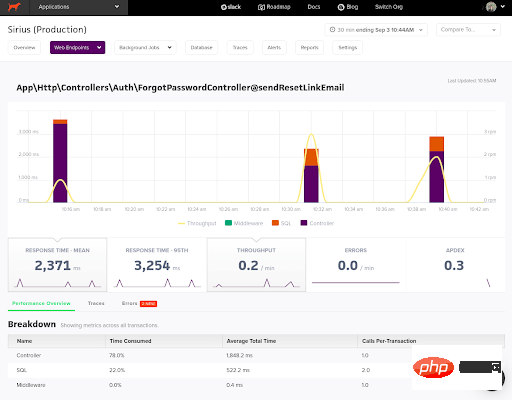
Scout 主要提供两个级别的应用程序性能指标。首先,从端点的角度来看。例如,平均而言,访问此端点需要多长时间?时间花费在哪里?
如果您查看下面的屏幕截图,您可以清楚地看到,在 3 次访问此 ForgetPasswordController 端点的 2,371 毫秒平均请求时间中,有 78% 花费在控制器层,这表明这将是第一个调查是否我们想尝试改善这个缓慢的端点。
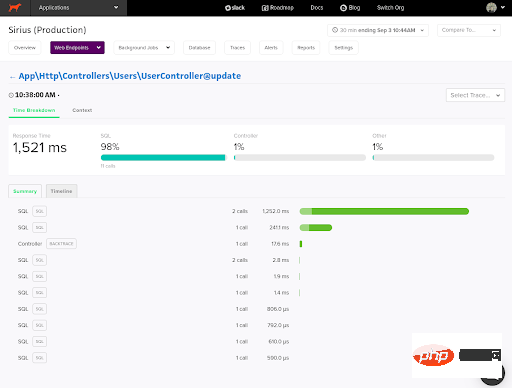
Scout 主要展示指标的第二个角度是在 Trace 级别。例如,在某人发出这个特定的 Web 请求期间,需要多长时间才能完成,以及请求的哪些级别消耗的时间最多等。查看下面 UserController 的更新操作的跟踪,我们可以看到在在这种情况下,98% 的时间都花在了 SQL 层上,而大部分时间都花在了对第一行查询的那 2 次调用上。如果我们点击那个 SQL 按钮,我们可以看到一个回溯,看看我们是否可以改进查询。
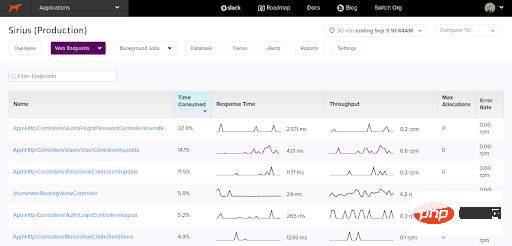
这些页面是您在 Scout 中花费大部分时间的地方,它们为您提供了在尝试了解您的性能问题时必不可少的可见性。您可以直接从主概览页面和洞察选项卡访问 Endpoint 和 Trace 页面,或者单击页面顶部的 Web Endpoints 链接(如下所示)。
现在我们已经介绍了 Scout 的基础知识并向您展示了您通常会日复一日使用的系统的主要区域,现在让我们将注意力转移到一些更高级的功能上,这些功能使 Scout 在 APM 领域脱颖而出。
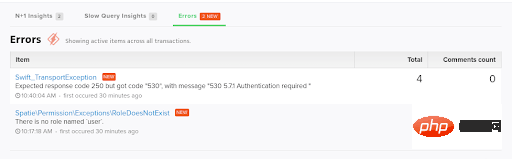
无论您是使用 Sentry、Honeybadger、Bugsnag 还是 Rollbar 进行错误监控,我们都能满足您的需求! Scout 与这些流行的服务无缝集成,让您可以在主概览页面上的一个地方进行所有监控。
无论您使用哪种服务,设置过程都是相似的,并且 所涉及的只是在 Scout 的设置屏幕上添加 API 令牌。
为什么此性能问题仅在周二晚上 2:00 AM 从巴西 IP 地址发生?这些困难(但常见)的性能问题可以通过 Scout 最强大的功能之一来解决:与用户定义的自定义上下文结合使用的跟踪资源管理器。
使用定义的自定义上下文允许您告诉我们您需要查看的内容。值得投入 相对较短的设置时间 以获得监控超能力!默认情况下,您将看到的唯一上下文字段是 URI 和主机名,如下所示,但这些可以自定义为您想要的任何内容。
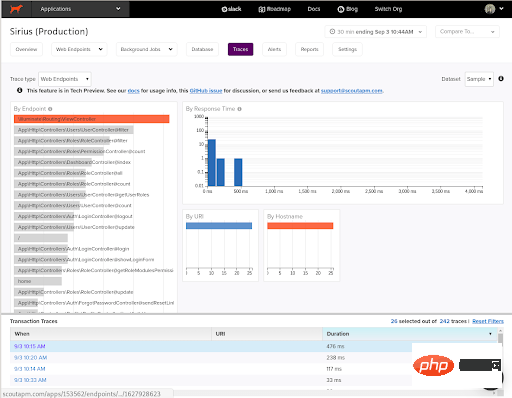
跟踪资源管理器 的多过滤器图表(如上所示)允许您检查与您定义的条件匹配的端点,然后您可以在屏幕的 Transaction Traces 部分中查看与这些过滤器匹配的所有跟踪。例如,也许您想查看某个用户的 Web 请求,或者某个计划的所有用户的 Web 请求,或者来自世界某个地区的 Web 请求。这些操作在带有自定义上下文的跟踪资源管理器中很容易完成,它们可以帮助您深入了解那些难以诊断、耗时的性能问题。
您看这个性能问题是否在上次部署后突然开始发生? 在您部署期间的用户体验如何? 这些是可以使用部署跟踪功能来回答,该功能将在主概览图表上放置一个火箭符号以指示部署何时发生。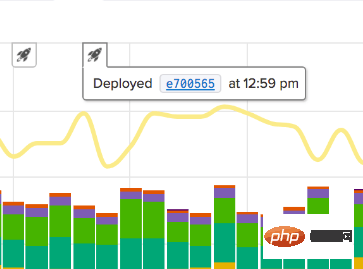
部署追踪还允许您查看详细信息,例如部署中涉及的提交数量和来自哪个分支的提交。当您将 SHA 或您的部署添加到 SCOUT_REVISON_SHA 环境变量中时,我们可以收集所有这些信息。
与所有优秀监控方案一样,Scout 为您提供了一个复杂的警报系统,该系统可以配置为在端点响应时间或内存使用指标超过某个阈值时,向某些人发送警报。这些警报将在主概览图上显示为警告符号,并发出通知。
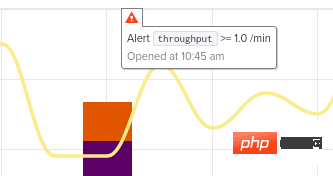
默认情况下,系统警报将通过邮件发送通知给通知组中的用户,但也可以通过我们的 webhook 功能将其配置与 Slack、VictorOps、PagerDuty 等第三方服务一起工作。
您是否在使用 Laravel 之外的库,而我们目前没有检测到这些库?如果是这样,那么首先让我们的支持团队知道,我们将尝试为您添加支持。于此同时,您可以自己添加一些自定义工具,它 非常容易上手,它将确保您对整个应用程序有完全的可见性。
正如您所见,Scout APM 为 PHP 和 Laravel 社区带来了一个非常成熟的 APM 监控方案。我们整洁的 UI 和深入的工具有助于您快速找到问题的核心,同时由于灵活的基于交易的定价结构,您仍然可以负担得起。
原文地址:https://laravel-news.com/scout-apm-for-monitoring-a-laravel-application译文地址:https://learnku.com/laravel/t/68744
【相关推荐:laravel视频教程】
以上就是如何使用Scout APM监控Laravel程序?的详细内容,更多请关注php中文网其它相关文章!

每个人都需要一台速度更快、更稳定的 PC。随着时间的推移,垃圾文件、旧注册表数据和不必要的后台进程会占用资源并降低性能。幸运的是,许多工具可以让 Windows 保持平稳运行。

Copyright 2014-2025 https://www.php.cn/ All Rights Reserved | php.cn | 湘ICP备2023035733号


 1009
1009