 Development Tools
 VSCode
 I will guide you step by step to learn how to debug VSCode. If you don't believe it, you still can't!
I will guide you step by step to learn how to debug VSCode. If you don't believe it, you still can't!
It’s 2022, it’s time to learn to use VSCode to debug! The following article will guide you step by step on how to learn VSCode debugging. I hope it will be helpful to you!

#VSCode is currently the most popular IDE and is also very popular among front-end developers. It is free, open source, and has many powerful features, such as smart prompts, plug-in store, integrated Git, etc., but in addition there is a feature that many developers ignore - Run and Debug. [Recommended learning: "vscode introductory tutorial"]
You may say, If you want Debug, Iconsole.logtakes a shuttle around the world. Yes, this is also the debugging method currently used by many people. But since VS Code has such a function, give it a try and you may gain something new~
Introduction
One of the key features of VS Code is that it has powerful debugging (debug) function, the built-in debugger (debugger) can help developers quickly edit, compile and debug.
VS Code’s built-in debugger supports the Node.js runtime and can debug JavaScript, TypeScript, and any other A language that can be compiled into JavaScript.
If you want to debug other languages and runtimes, including but not limited to PHP, Ruby, Go, C#Wait, you can find the relevant Debugger extension in the extension store and install it. We won’t go into too much detail here.
Simple debugging
In order to facilitate our understanding of common functions, it is easier to get started by debugging directly to learn related functions. Here we use a simple Node.js project as an example for debugging.
First prepare a app.js:
let msg = 'Hello world';
console.log(msg);
let numA = 6;
let numB = 13;
let num = numA + numB;
console.log(num);
so that we have a simple Node.js program.
Next we click on the run and debug icon in the left menu (the icon is a bug start, as the name suggests debug&run), here is the initialization panel; then we add breakpoints where breakpoints are needed in the code Click:
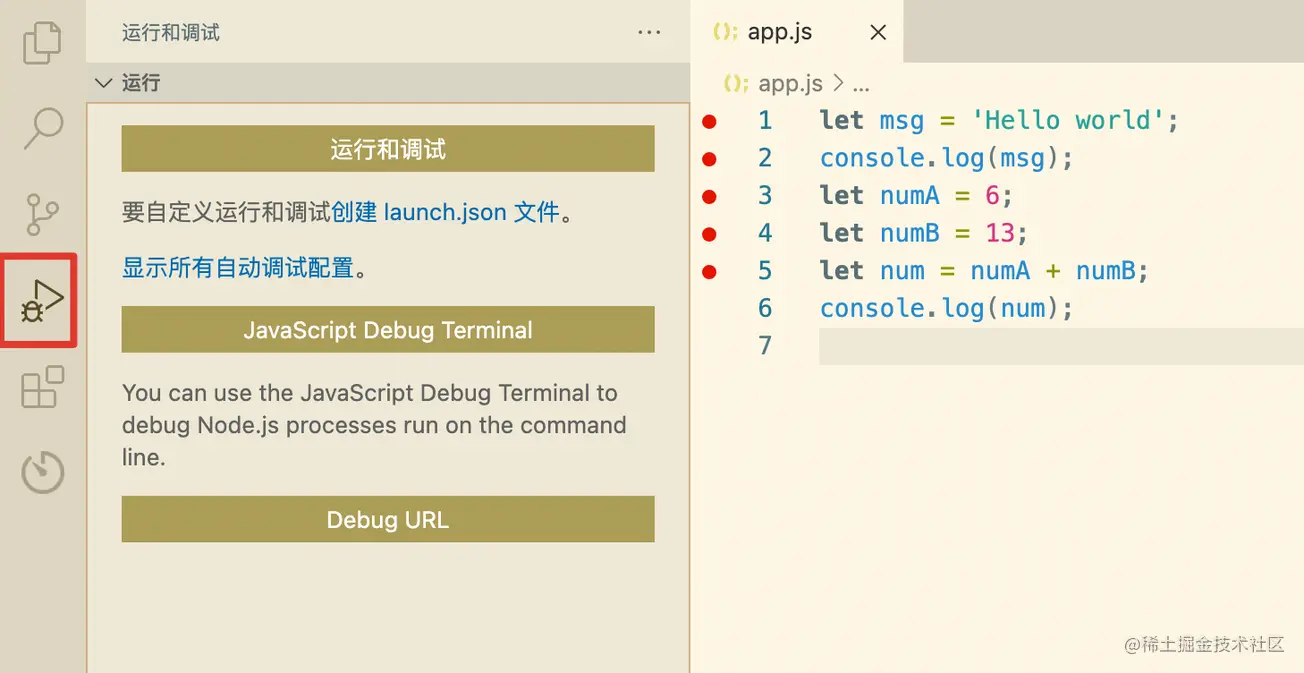
Click directly to run and debug:

The program runs and stops at the breakpoint Came down. The debug panel is also activated, showing panels for variables, monitoring, call stacks, and breakpoints. Click the first icon in the debugging operation bar above (continue, the shortcut key is F5), the program will go to the next breakpoint, and the msg variable in the variable panel will be updated:

Continue clicking to continue until the last breakpoint is jumped out, and our debugging step is over. This is the simplest debugging process of Node.js program.
Of course, we will definitely not have such a simple program in actual development, so next we will introduce the related functions in debugging in detail.
Function introduction
Although the above example is the
Node.jsproject, most of the concepts and features are common to other debuggers. of.
Run Panel and Menu
In the above example we have already seen the run panel. Click the "Run and Debug" icon on the left to open the panel. The run panel displays all relevant information about running and debugging.
If launch.json has not been configured, then VS Code will display the initial state panel. In the example, we have not configured it, so the display is the initial state:

In addition to the icons on the left, you can also use the top-level menu to run (Run). The commands here are basically the same as those in the panel:

You can also look here if you can’t remember the shortcut keys~
Startup configuration
In the above example, we selected "Run and Debug", and VS Code directly used the built-in Node.js debugging configuration to start the debugging step .
However, in most scenarios, we will not have such simple debugging. At this point it is necessary to create a custom launch configuration file. We can save some debugging details in the configuration file.
VS Code saves the debugging configuration information in the launch.json file in the .vscode directory (the .vscode directory generally exists in the root directory of the project).
要创建一个launch.json文件,在运行初始化面板中点击“创建一个launch.json”:

VS Code会去尝试自动检测当前调试环境。如果它失败了,我们就需要自己手动选择:

选择Node.js后,VS Code会自动生成配置文件以及.vscode目录。这里是Node.js默认的launch.json:
{
    // 使用 IntelliSense 了解相关属性。
    // 悬停以查看现有属性的描述。
    // 欲了解更多信息,请访问: https://go.microsoft.com/fwlink/?linkid=830387
    "version": "0.2.0",
    "configurations": [
        {
            "type": "pwa-node",
            "request": "launch",
            "name": "Launch Program",
            "skipFiles": [
                "<node_internals>/**"
            ],
            "program": "${workspaceFolder}/app.js"
        }
    ]
}这里需要注意的是,对于不同类型的调试器,launch配置中的属性可能都是各不相同的。可以使用VS Code内置的智能提示功能去查看有哪些属性可用,hover属性就可以看到帮助信息。
不要想当然地认为某个调试器中存在的属性放到其他的调试器下中也能起作用。调试前要确保所有配置都是有意义的。
launch和attach
在VS Code中,有两种核心的调试模式,Launch和Attach,他们为开发者提供两种不同类型的工作流。
最简单的方式来理解这两种工作流:
- launch配置可以理解为VS Code启动调试程序的说明书;
- attach配置则是如何将VS Code的调试器连接到已运行的应用程序或进程的方法;
VS Code的调试支持用调试模式启动一个程序,或者用调试模式附加到一个已经在运行中的程序。使用哪种调试配置,取决于我们的调试需求。
launch属性
当你在launch.json中配置了type属性的值后,就可以使用VS Code的智能提示(command+I)来查看所有可用的属性:

下面的属性是每个launch配置文件必须具备的:
-
type- 调试器的类型。 -
request- 请求类型,目前支持launch和attach -
name- 在Debug启动配置下拉菜单中显示的名字
下面是一些可选的配置属性:
-
presentation- 在presentation对象中,用order,group, 和hidden属性可以在调试配置下拉菜单以及快速选择调试选项中进行排序、分组以及隐藏配置。 -
preLaunchTask- 在开始一个调试会话前可以启动一个任务 -
postDebugTask- 在结束调试后启动一个任务 -
internalConsoleOptions- 这个属性用来控制调试控制台面板的可见性。 -
debugServer- 只为调试扩展的作者使用(for debug extension authors only) 这个属性允许你去连接到一个特定的端口而不是去启动调试适配器。 -
serverReadyAction- 如果要在调试中的程序向调试控制台或集成终端输出特定消息时在web浏览器中打开URL。
许多调试器支持以下的属性:
-
program- 当启动调试器时要运行的可执行程序或文件 -
args- 传给程序用来调试的参数 -
env- 环境变量 (null值可以用来 "undefine" 一个变量) -
envFile- 具有环境变量的.env文件的路径 -
cwd- 用来寻找依赖和其他文件的当前工作目录 -
port- 连接到正在运行的进程时的端口 -
stopOnEntry- 当程序启动时立即停止 -
console- 使用哪种控制台,例如internalConsole,integratedTerminal, orexternalTerminal
变量替换
VS Code在launch.json中提供了许多有用的变量,并在启动时支持字符串内部的变量替换。例如,${workspaceFolder}给出了工作区文件夹的根路径,${file}给出了在活动编辑器中打开的文件,${env:Name}给出了环境变量Name的值。可以查看变量引用 来查看所有的预定义变量。
调试操作
When the debugging session is started, the debugging toolbar will be displayed at the top:

From left to right:
- Continue/ Pause
F5: Execute to the next breakpoint - Single-step skip
F10: Execute single-step debugging from the breakpoint - Single-step debugging
F11: Enter inside the function - Single step out
shift F11: Jump out of the inside of the function - Restart
shift command F11 - End
shift F5
Breakpoints
Click on the left margin of the editor Breakpoints can be switched (shortcut key is F9). You have more control over breakpoints in the Breakpoints section of Run view.
#The breakpoints on the left side of the editor are generally displayed as red solid circles, and unavailable breakpoints are displayed as gray solid circles. If the debugger supports exiting on different errors or exceptions, this will also be available in the breakpoints section.
Logpoints
Logpoints are a variant of breakpoints. They will not break into the debugger, but they can Print some information in the console. Record points are particularly useful when debugging production services that cannot be paused or stopped.
The recording point is displayed as a diamond icon. Log messages are interpreted text but can also use computable expressions (wrapped in curly braces)


Just like ordinary breakpoints, recording points can be enabled, disabled, and controlled by conditions.
Node.js debugging
There are three ways to debug Node.js in VS Code:
- Use
auto attach in the integrated terminal of VS CodeTo debug the program; - Use JavaScript to debug the terminal
- Use launch configuration, or attach to other programs
Auto Attach
When the Auto Attach function is enabled, the Node debugger will automatically attach to the Node.js process started in VS Code.
Command Shift POpen inputAuto Attach to enable the function:


Among the three options here, we can choose smart. After opening it, restart VS Code. The debugger will be automatically attached after starting the program. At this time, the status bar below will display the status of auto attach, and you can also click to change it.

JavaScript integrated terminal
Similar to auto attach, use JavaScript for debugging The terminal can automatically debug any Node.js program you run in the terminal. Select JavaScript Debug Terminal in the drop-down selection box of the terminal:

##Launch Configuration Debugging
Debugging by configuring launch.json is a relatively traditional debugging method. You can configure it according to your own project code requirements and have high flexibility. In addition to starting the Node.js program directly through the node command, we can also use npm or other tools for debugging through configuration.- Any program available on PATH (such as npm, gulp, etc.) can be used in the
- runtimeExecutable
attribute, and parameters can be placed inruntimeArgsincoming. If an npm script or other tool implicitly specifies a program to start, the - program
attribute does not have to be set.
Remember an incomplete source code debugging npm install is debugged in this way.
SourceMap DebuggingVS Code’sJavaScript debugger support can help debug source maps of escaped languages (e.g. Typescript, compressed or obfuscated JavaScript, etc.). Use source map to step through debugging or set breakpoints in the source code.
If source map does not exist in the original code, or source map is damaged and cannot successfully map the original code and the generated JavaScript, the breakpoint is displayed It is unverified (gray hollow circle), as shown below:

source map function is controlled by the sourceMaps attribute, the default is true. The prerequisite for using source map for debugging is that our project code must be able to generate the source map file before it can be used, so if we use Typescript, babel, webpack, etc. need to be configured accordingly to generate the source map file before performing the corresponding configuration and use. For details, please view the official documentation related to VSCode-Source map.
If you want to use VS Code to debug vue projects, you can refer to # How to make debugging Vue and React code more enjoyable. This configuration is available in vue2 projects, but vue3 has not yet been successfully implemented.
Advanced breakpoints
Finally, I will introduce some advanced breakpoint functions in VS Code. You may not use them in daily debugging, but you can learn about them.
Conditional breakpoints
One of the powerful debugging features in VS Code is the ability to based on an expression, the number of hits, or both The ability to set conditions by a combination of
- Expression condition: Whenever an expression evaluates to true, the breakpoint is hit.
- Number of hits: "Number of hits" controls how many times the breakpoint needs to be clicked to interrupt execution.
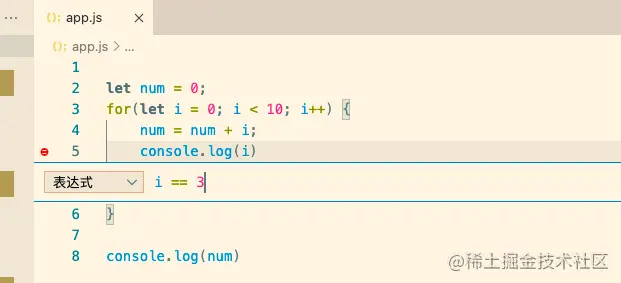
You can add conditions or hit times when creating a breakpoint or modifying an existing breakpoint. In both cases, an inline text box opens with a drop-down menu where the expression can be entered:

wheni=3, it will stop at the breakpoint:
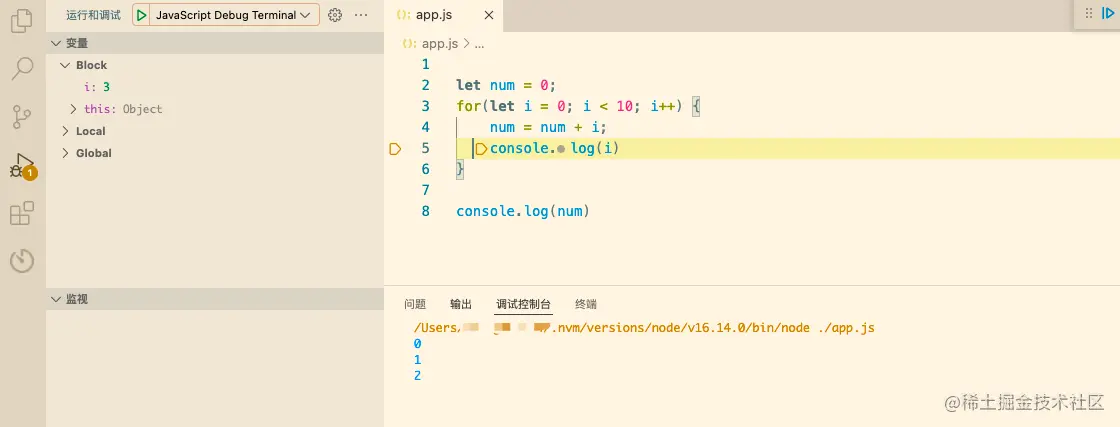
or set the number of hits:
The number of hits is equal to 5 Stop at the breakpoint:
If the debugger does not support conditional breakpoints, the add and edit menus will not be displayed.
Inline breakpoints
Inline breakpoints are hit only when execution reaches the column associated with the inline breakpoint. Useful when debugging small code that contains multiple statements in one line, such as a for loop:
Add an inline breakpoint with shift F9. Inline breakpoints are displayed inline in the editor.
Summary
The debugging function of VSCode is still very powerful. The above introduction is only part of the content. There is still a lot of content to explore in the official documents.
Although for a framework like vue.js which has its own devtool, it is more intuitive to debug directly in the browser, but debugging other Node.js Program, using VS Code is still very efficient.
For more knowledge about VSCode, please visit: vscode tutorial! !
The above is the detailed content of I will guide you step by step to learn how to debug VSCode. If you don't believe it, you still can't!. For more information, please follow other related articles on the PHP Chinese website!

Hot AI Tools

Undresser.AI Undress
AI-powered app for creating realistic nude photos

AI Clothes Remover
Online AI tool for removing clothes from photos.

Undress AI Tool
Undress images for free

Clothoff.io
AI clothes remover

Video Face Swap
Swap faces in any video effortlessly with our completely free AI face swap tool!

Hot Article

Hot Tools

Notepad++7.3.1
Easy-to-use and free code editor

SublimeText3 Chinese version
Chinese version, very easy to use

Zend Studio 13.0.1
Powerful PHP integrated development environment

Dreamweaver CS6
Visual web development tools

SublimeText3 Mac version
God-level code editing software (SublimeText3)

Hot Topics
 1662
1662
 14
14
 1418
1418
 52
52
 1311
1311
 25
25
 1261
1261
 29
29
 1234
1234
 24
24
 What computer configuration is required for vscode
Apr 15, 2025 pm 09:48 PM
VS Code system requirements: Operating system: Windows 10 and above, macOS 10.12 and above, Linux distribution processor: minimum 1.6 GHz, recommended 2.0 GHz and above memory: minimum 512 MB, recommended 4 GB and above storage space: minimum 250 MB, recommended 1 GB and above other requirements: stable network connection, Xorg/Wayland (Linux)
 How to define header files for vscode
Apr 15, 2025 pm 09:09 PM
How to define header files using Visual Studio Code? Create a header file and declare symbols in the header file using the .h or .hpp suffix name (such as classes, functions, variables) Compile the program using the #include directive to include the header file in the source file. The header file will be included and the declared symbols are available.
 vscode terminal usage tutorial
Apr 15, 2025 pm 10:09 PM
vscode built-in terminal is a development tool that allows running commands and scripts within the editor to simplify the development process. How to use vscode terminal: Open the terminal with the shortcut key (Ctrl/Cmd). Enter a command or run the script. Use hotkeys (such as Ctrl L to clear the terminal). Change the working directory (such as the cd command). Advanced features include debug mode, automatic code snippet completion, and interactive command history.
 Where to write code in vscode
Apr 15, 2025 pm 09:54 PM
Writing code in Visual Studio Code (VSCode) is simple and easy to use. Just install VSCode, create a project, select a language, create a file, write code, save and run it. The advantages of VSCode include cross-platform, free and open source, powerful features, rich extensions, and lightweight and fast.
 How to solve the problem of vscode Chinese annotations becoming question marks
Apr 15, 2025 pm 11:36 PM
How to solve the problem that Chinese comments in Visual Studio Code become question marks: Check the file encoding and make sure it is "UTF-8 without BOM". Change the font to a font that supports Chinese characters, such as "Song Style" or "Microsoft Yahei". Reinstall the font. Enable Unicode support. Upgrade VSCode, restart the computer, and recreate the source file.
 Common commands for vscode terminal
Apr 15, 2025 pm 10:06 PM
Common commands for VS Code terminals include: Clear the terminal screen (clear), list the current directory file (ls), change the current working directory (cd), print the current working directory path (pwd), create a new directory (mkdir), delete empty directory (rmdir), create a new file (touch) delete a file or directory (rm), copy a file or directory (cp), move or rename a file or directory (mv) display file content (cat) view file content and scroll (less) view file content only scroll down (more) display the first few lines of the file (head)
 vscode Previous Next Shortcut Key
Apr 15, 2025 pm 10:51 PM
VS Code One-step/Next step shortcut key usage: One-step (backward): Windows/Linux: Ctrl ←; macOS: Cmd ←Next step (forward): Windows/Linux: Ctrl →; macOS: Cmd →
 vscode terminal command cannot be used
Apr 15, 2025 pm 10:03 PM
Causes and solutions for the VS Code terminal commands not available: The necessary tools are not installed (Windows: WSL; macOS: Xcode command line tools) Path configuration is wrong (add executable files to PATH environment variables) Permission issues (run VS Code as administrator) Firewall or proxy restrictions (check settings, unrestrictions) Terminal settings are incorrect (enable use of external terminals) VS Code installation is corrupt (reinstall or update) Terminal configuration is incompatible (try different terminal types or commands) Specific environment variables are missing (set necessary environment variables)


