

How to enable nodejs debugging? How to debug nodejs program?

How to debug a nodejs program? The following article will introduce you to the nodejs debugging method. I hope it will be helpful to you!

For developers, in the process of developing applications, they often need to resort to the debugging function of the programming language for the convenience of development and to solve bugs. Generally speaking, we need to use the debugging function of a powerful IDE to complete this work. nodejs is no exception.
Today we will introduce in detail how to debug the node program.
Enable nodejs debugging
Do you remember the koa program we talked about before? This article will take a simple koa server program as an example to start debugging nodejs.
Let’s first look at a simple koa service app.js:
const Koa = require('koa');
const app = module.exports = new Koa();

app.use(async function(ctx) {
  ctx.body = 'Hello World';
});

if (!module.parent) app.listen(3000);The above program opens port 3000 and establishes an http service. Every time a request is made, hello World will be returned, which is very simple.
To run the above program, we need to execute node app.js. This will execute app.js but will not enable debugging.
How to debug?
We need to add the --inspect parameter:
node --inspect app.js
The above code will enable the debugging function of nodejs.
Let’s take a look at the output:
Debugger listening on ws://127.0.0.1:9229/88c23ae3-9081-41cd-98b0-d0f7ebceab5a
For help, see: https://nodejs.org/en/docs/inspector
The results tell us two things. The first thing is the port that the debugger listens to. By default, port 9229 of 127.0.0.1 will be opened. And assigned a unique UUID for differentiation.
The second thing is to tell us that the debugger used by nodejs is Inspector.
Inspector was introduced after nodejs 8. If it is before nodejs 7, then the legacy debugger is used.
Debugging security
If the debugger is connected to the nodejs running environment, if there is a malicious attacker, the malicious attacker can run arbitrary code in the nodejs environment . This will bring great security risks to our program.
So we must pay attention to the safety of debugging. Generally speaking, we do not recommend remote debugging.
By default, --inspect is bound to 127.0.0.1, which only allows local programs to access. And any locally running program has permission to debug the program.
If we really want to expose the debug program to external programs, we can specify the external IP address of the machine or 0.0.0.0 (indicating any address, no restrictions), so that the remote machine can perform remote Debugged.
What should we do if we want to perform safe remote debugging?
First, we need to enable local debugging:
node --inspect app.js
Then we can build an ssh tunnel to map the local 9221 port to the remote server's 9229 port:
ssh -L 9221:localhost:9229 user@remote.example.com
In this way, we can perform remote debugging by connecting to the local 9221 port.
Use WebStorm for nodejs debugging
WebStorm produced by JetBrains can be said to be a powerful tool for developing nodejs. WebStorm has its own debug option. If this option is turned on, it will Turn on --inspect:
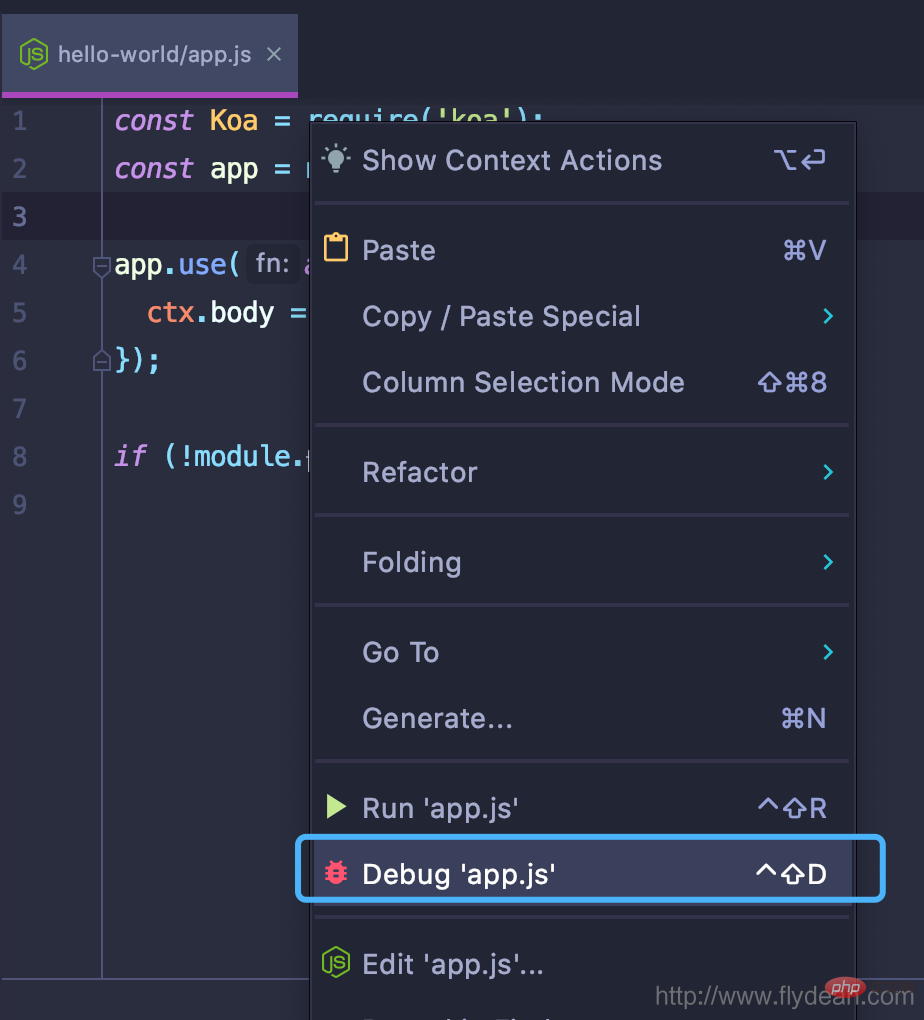
Using WebStorm for debugging is similar to using IDEA for java program debugging, so I won’t go into details here.
Use Chrome devTools for debugging
The prerequisite for using Chrome devTools for debugging is that we have turned on the --inspect mode.
Enter chrome://inspect in chrome:
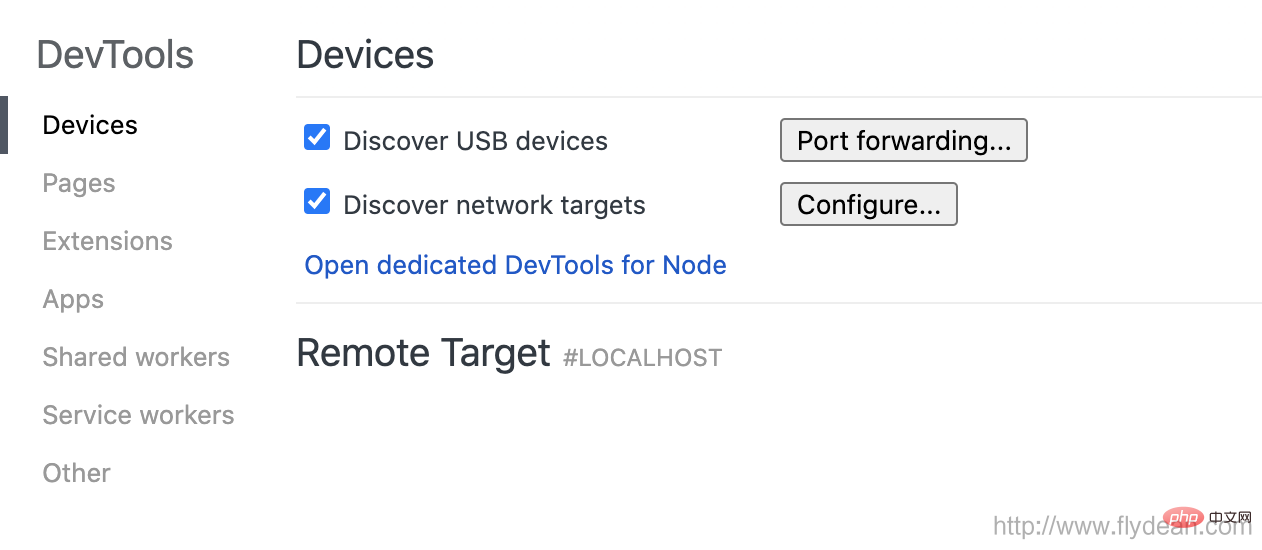
We can see the chrome inspect interface. If you already have a nodejs program that has inspect enabled locally, If so, you can see it directly in Remote Target.
Select the target you want to debug and click inspect to open the Chrome devTools debugging tool:
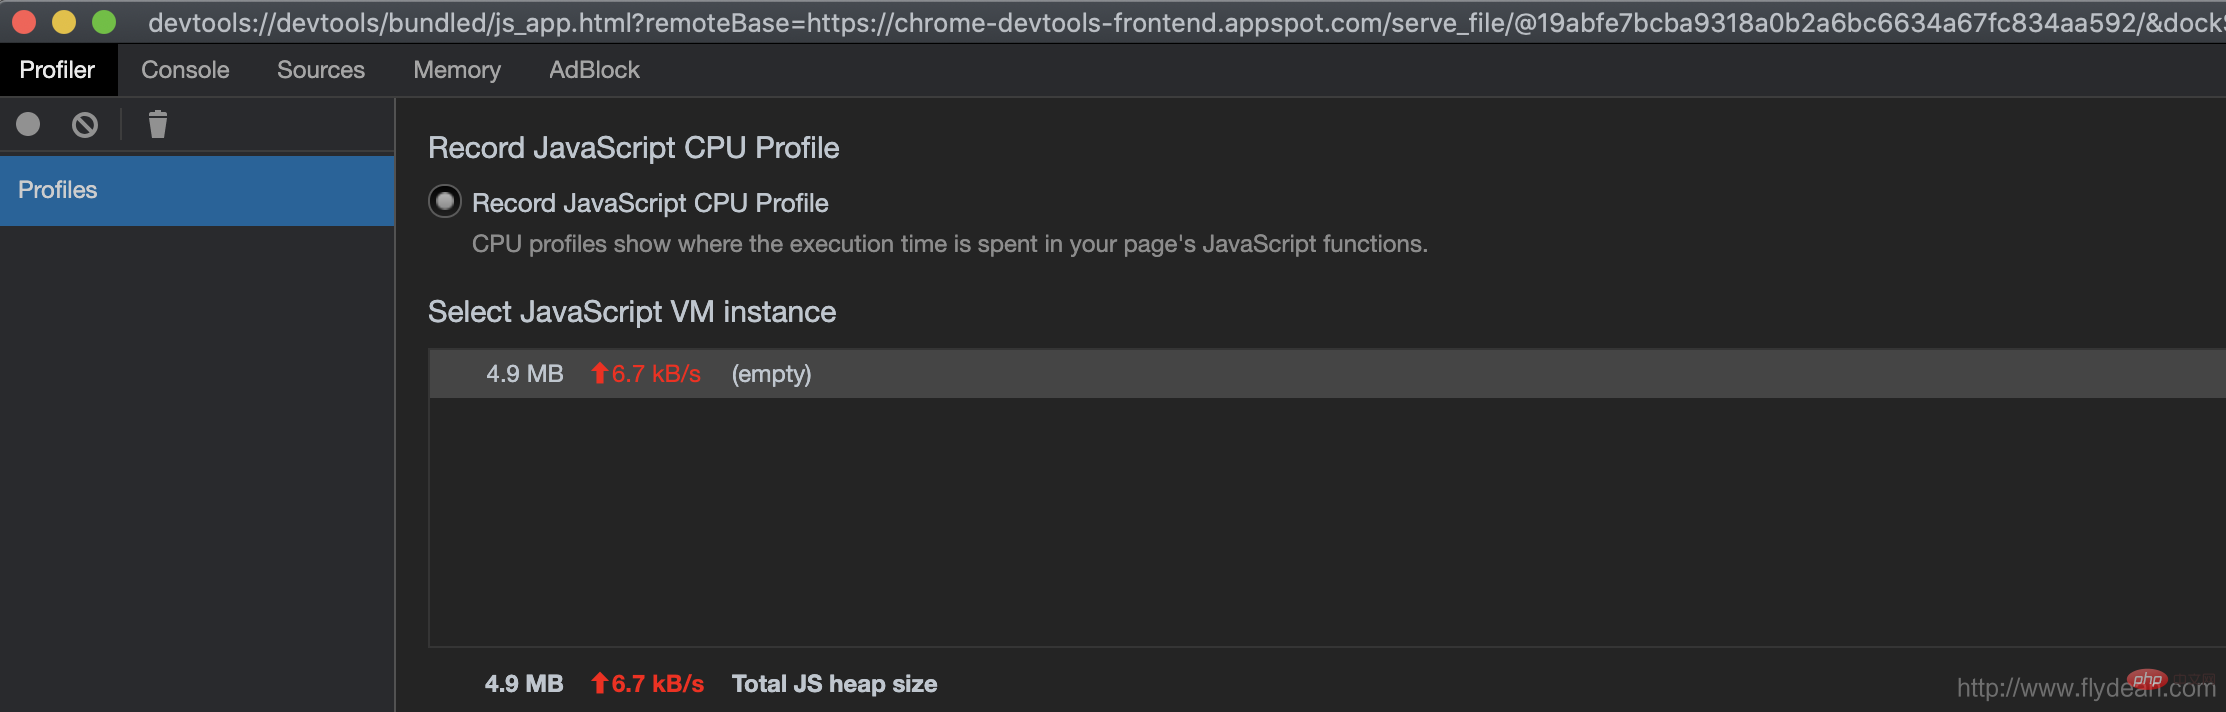
You can profile the program and debug it. .
Here we are focusing on debugging, so go to the source column and add the source code of the program you want to debug:
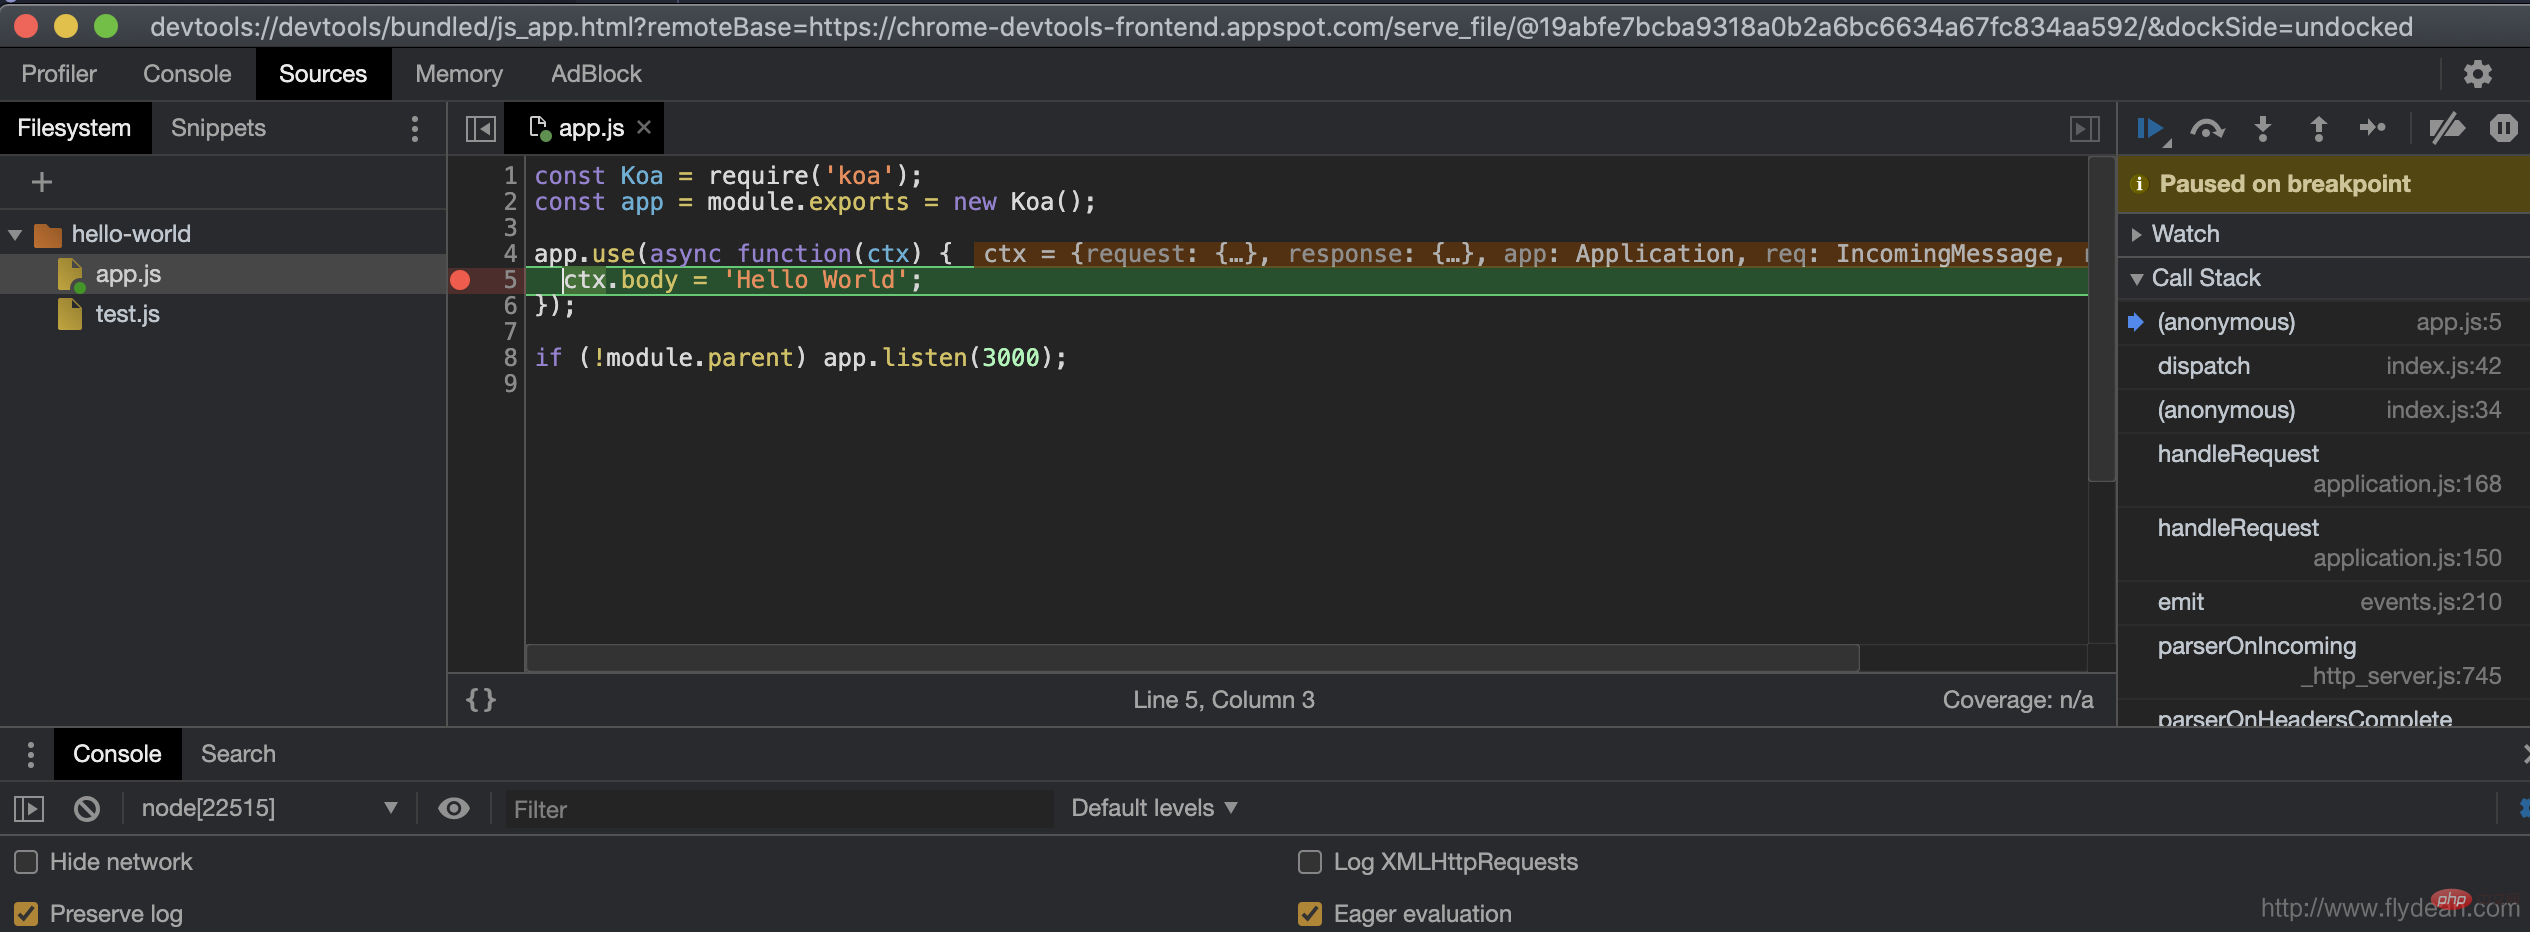
Just add a breakpoint Debugging started. It is the same as debugging js on the web side in chrome.
Use node-inspect for debugging
In fact, nodejs has a built-in debugging tool called node-inspect, which is a cli debugging tool. Let's see how to use it.
We directly use:
node inspect app.js < Debugger listening on ws://127.0.0.1:9229/f1c64736-47a1-42c9-9e9e-f2665073d3eb < For help, see: https://nodejs.org/en/docs/inspector < Debugger attached. Break on start in app.js:1 > 1 const Koa = require('koa'); 2 const app = module.exports = new Koa(); 3 debug>
node inspect does two things. The first thing is to generate a subroutine to run node --inspect app.js. The second thing is to Run the CLI debug window in the program.
This CLI debugger provides us with some very useful commands:
1, Stepping
- cont, c : Continue to execute
- next, n: Step to the next step
- step, s: Step in
- out, o: Step out
- pause: Pause Running code
2, Breakpoints
- setBreakpoint(), sb(): Set a breakpoint on the current line
- setBreakpoint(line), sb(line): Set a breakpoint on the specified line
- setBreakpoint ('fn()'), sb(…): Set a breakpoint in the specified function
- setBreakpoint('script.js', 1), sb(…): Set it in the specified script file Breakpoint
- clearBreakpoint('script.js', 1), cb(…): Clear breakpoint from the file
3, Information
- backtrace, bt: Print the backtrace information of the current execution frame
- list(5): List the 5 lines before and after the source code
- watch(expr): Add a monitor Expression
- unwatch(expr): Delete the watch expression
- watchers: List all watchers
- repl: Open the repl expression
- exec expr : Execute expression
Through the above command, we can perform more complex debugging activities in the CLI.
Other debug clients
In addition to the ones we mentioned above, we can also use vscode, Visual Studio, Eclipse IDE, etc. to perform nodejs Debugging will not be introduced in detail here.
Interested friends can explore on their own.
For more node-related knowledge, please visit: nodejs tutorial! !
The above is the detailed content of How to enable nodejs debugging? How to debug nodejs program?. For more information, please follow other related articles on the PHP Chinese website!

Hot AI Tools

Undresser.AI Undress
AI-powered app for creating realistic nude photos

AI Clothes Remover
Online AI tool for removing clothes from photos.

Undress AI Tool
Undress images for free

Clothoff.io
AI clothes remover

Video Face Swap
Swap faces in any video effortlessly with our completely free AI face swap tool!

Hot Article
Hot Tools

Notepad++7.3.1
Easy-to-use and free code editor

SublimeText3 Chinese version
Chinese version, very easy to use

Zend Studio 13.0.1
Powerful PHP integrated development environment

Dreamweaver CS6
Visual web development tools

SublimeText3 Mac version
God-level code editing software (SublimeText3)
Hot Topics


 Detailed explanation of C++ function debugging: How to debug problems in multi-threaded functions?
May 02, 2024 pm 04:15 PM
Detailed explanation of C++ function debugging: How to debug problems in multi-threaded functions?
May 02, 2024 pm 04:15 PM
C++ multi-thread debugging can use GDB: 1. Enable debugging information compilation; 2. Set breakpoints; 3. Use infothreads to view threads; 4. Use thread to switch threads; 5. Use next, stepi, and locals to debug. Actual case debugging deadlock: 1. Use threadapplyallbt to print the stack; 2. Check the thread status; 3. Single-step the main thread; 4. Use condition variables to coordinate access to solve the deadlock.
 How to use LeakSanitizer to debug C++ memory leaks?
Jun 02, 2024 pm 09:46 PM
How to use LeakSanitizer to debug C++ memory leaks?
Jun 02, 2024 pm 09:46 PM
How to use LeakSanitizer to debug C++ memory leaks? Install LeakSanitizer. Enable LeakSanitizer via compile flag. Run the application and analyze the LeakSanitizer report. Identify memory allocation types and allocation locations. Fix memory leaks and ensure all dynamically allocated memory is released.
 Shortcut to golang function debugging and analysis
May 06, 2024 pm 10:42 PM
Shortcut to golang function debugging and analysis
May 06, 2024 pm 10:42 PM
This article introduces shortcuts for Go function debugging and analysis, including: built-in debugger dlv, which is used to pause execution, check variables, and set breakpoints. Logging, use the log package to record messages and view them during debugging. The performance analysis tool pprof generates call graphs and analyzes performance, and uses gotoolpprof to analyze data. Practical case: Analyze memory leaks through pprof and generate a call graph to display the functions that cause leaks.
 How to conduct concurrency testing and debugging in Java concurrent programming?
May 09, 2024 am 09:33 AM
How to conduct concurrency testing and debugging in Java concurrent programming?
May 09, 2024 am 09:33 AM
Concurrency testing and debugging Concurrency testing and debugging in Java concurrent programming are crucial and the following techniques are available: Concurrency testing: Unit testing: Isolate and test a single concurrent task. Integration testing: testing the interaction between multiple concurrent tasks. Load testing: Evaluate an application's performance and scalability under heavy load. Concurrency Debugging: Breakpoints: Pause thread execution and inspect variables or execute code. Logging: Record thread events and status. Stack trace: Identify the source of the exception. Visualization tools: Monitor thread activity and resource usage.
 How to debug PHP asynchronous code
May 31, 2024 am 09:08 AM
How to debug PHP asynchronous code
May 31, 2024 am 09:08 AM
Tools for debugging PHP asynchronous code include: Psalm: a static analysis tool that can find potential errors. ParallelLint: A tool that inspects asynchronous code and provides recommendations. Xdebug: An extension for debugging PHP applications by enabling a session and stepping through the code. Other tips include using logging, assertions, running code locally, and writing unit tests.
 What are the debugging techniques for recursive calls in Java functions?
May 05, 2024 am 10:48 AM
What are the debugging techniques for recursive calls in Java functions?
May 05, 2024 am 10:48 AM
The following techniques are available for debugging recursive functions: Check the stack traceSet debug pointsCheck if the base case is implemented correctlyCount the number of recursive callsVisualize the recursive stack
 PHP Debugging Errors: A Guide to Common Mistakes
Jun 05, 2024 pm 03:18 PM
PHP Debugging Errors: A Guide to Common Mistakes
Jun 05, 2024 pm 03:18 PM
Common PHP debugging errors include: Syntax errors: Check the code syntax to make sure there are no errors. Undefined variable: Before using a variable, make sure it is initialized and assigned a value. Missing semicolons: Add semicolons to all code blocks. Function is undefined: Check that the function name is spelled correctly and make sure the correct file or PHP extension is loaded.
 Detailed explanation of C++ function debugging: How to debug problems in functions that contain exception handling?
Apr 30, 2024 pm 01:36 PM
Detailed explanation of C++ function debugging: How to debug problems in functions that contain exception handling?
Apr 30, 2024 pm 01:36 PM
C++ debugging functions that contain exception handling uses exception point breakpoints to identify exception locations. Use the catch command in gdb to print exception information and stack traces. Use the exception logger to capture and analyze exceptions, including messages, stack traces, and variable values.
