 WeChat Applet
 Mini Program Development
 How to use echarts in the WeChat mini program and possible pitfalls, come and collect it to avoid lightning! !
How to use echarts in the WeChat mini program and possible pitfalls, come and collect it to avoid lightning! !
This article will share with you some methods of using echarts in WeChat mini programs and a summary of problems, so that you can avoid pitfalls and thunderstorms. I hope it can help you!

How to use the WeChat mini program and some pitfalls, I hope it can help you
Using echarts in the WeChat mini program
1. Download the mini program version of echarts
Download address: https://github.com/ecomfe/echarts- for-weixin
2. Use steps
##1.Introduce project dependencies
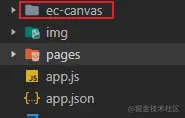
After pulling the WeChat applet version echarts from github, copy the ec-canvas file in the file to your own project. It is actually the dependency file of the WeChat applet version echarts. [Related learning recommendations:小program development tutorial】

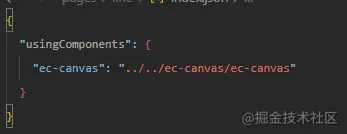
Introduce echarts into the json file of the page where echarts is used. The imported path is imported according to your own project structure.
You can also introduce it in the global configuration file app.json, so that everything is The page is universal and does not need to be introduced one by one. When multiple pages use echarts, it is more convenient Introduce echarts into the js file of the page using echarts. The imported path is imported according to your own project structure

Use the component
<view class="container">
  <ec-canvas id="mychart-dom-bar" canvas-id="mychart-bar" ec="{{ ec }}"></ec-canvas>
</view>js code
For option configuration, you can go to the official website to read the documentation or refer to the example, https://echarts.apache.org /zh/option.html#titlecss codeimport * as echarts from '../../ec-canvas/echarts'; const app = getApp(); function initChart(canvas, width, height, dpr) { //主要是这个 echarts 的创建 const chart = echarts.init(canvas, null, { width: width, height: height, devicePixelRatio: dpr // new }); canvas.setChart(chart); // option 的配置可以根据自己的需求去 echarts 官网查看配置的属性方法 var option = { backgroundColor: "#ffffff", series: [{ label: { normal: { fontSize: 14 } }, type: 'pie', center: ['50%', '50%'], radius: ['20%', '40%'], data: [{ value: 55, name: '北京' }, { value: 20, name: '武汉' }, { value: 10, name: '杭州' }, { value: 20, name: '广州' }, { value: 38, name: '上海' }] }] }; chart.setOption(option); return chart; } Page({ data: { ec: { onInit: initChart } }, onReady() { } });Copy after login
.container{
  width: 100%;
  height: 100vw;
}
ec-canvas {
  width: 100%;
  height: 100%;
}1. Regarding the introduction of dependencies, introduce Library, after using it according to the official usage method, the problem of echarts picture not being displayed
Solution: When using echarts in HTML, the width and height of the view tag wrapped in the outer layer must also be set (The official method style does not set the width and height of the outer element, but it can be displayed in the official example, which misleads many people and will lead to a trap)
 2 , About the role of
You can see that when echarts is initially created in the official code, the code is as shown below. After you set devicePixelRatio, the chart of echarts can be seen in the WeChat developer tools The pixels of the echarts chart are very poor. When previewed on a mobile phone, they are very clear. After removing the devicePixelRatio, the pixels of the echarts chart seen in the WeChat developer tools become very clear, but the pixels seen on the mobile phone are poor. , so this should be adapted to the pixels of the chart according to the pixel unit of the device

The above is the detailed content of How to use echarts in the WeChat mini program and possible pitfalls, come and collect it to avoid lightning! !. For more information, please follow other related articles on the PHP Chinese website!

Hot AI Tools

Undresser.AI Undress
AI-powered app for creating realistic nude photos

AI Clothes Remover
Online AI tool for removing clothes from photos.

Undress AI Tool
Undress images for free

Clothoff.io
AI clothes remover

Video Face Swap
Swap faces in any video effortlessly with our completely free AI face swap tool!

Hot Article

Hot Tools

Notepad++7.3.1
Easy-to-use and free code editor

SublimeText3 Chinese version
Chinese version, very easy to use

Zend Studio 13.0.1
Powerful PHP integrated development environment

Dreamweaver CS6
Visual web development tools

SublimeText3 Mac version
God-level code editing software (SublimeText3)

Hot Topics
 1664
1664
 14
14
 1423
1423
 52
52
 1317
1317
 25
25
 1268
1268
 29
29
 1243
1243
 24
24
 ECharts and Java interface: How to quickly implement statistical charts such as line charts, bar charts, pie charts, etc.
Dec 17, 2023 pm 10:37 PM
ECharts and Java interface: How to quickly implement statistical charts such as line charts, bar charts, and pie charts. Specific code examples are required. With the advent of the Internet era, data analysis has become more and more important. Statistical charts are a very intuitive and powerful display method. Charts can display data more clearly, allowing people to better understand the connotation and patterns of the data. In Java development, we can use ECharts and Java interfaces to quickly display various statistical charts. ECharts is a software developed by Baidu
 Xianyu WeChat mini program officially launched
Feb 10, 2024 pm 10:39 PM
Xianyu's official WeChat mini program has quietly been launched. In the mini program, you can post private messages to communicate with buyers/sellers, view personal information and orders, search for items, etc. If you are curious about what the Xianyu WeChat mini program is called, take a look now. What is the name of the Xianyu WeChat applet? Answer: Xianyu, idle transactions, second-hand sales, valuations and recycling. 1. In the mini program, you can post idle messages, communicate with buyers/sellers via private messages, view personal information and orders, search for specified items, etc.; 2. On the mini program page, there are homepage, nearby, post idle, messages, and mine. 5 functions; 3. If you want to use it, you must activate WeChat payment before you can purchase it;
 How to use php interface and ECharts to generate visual statistical charts
Dec 18, 2023 am 11:39 AM
In today's context where data visualization is becoming more and more important, many developers hope to use various tools to quickly generate various charts and reports so that they can better display data and help decision-makers make quick judgments. In this context, using the Php interface and ECharts library can help many developers quickly generate visual statistical charts. This article will introduce in detail how to use the Php interface and ECharts library to generate visual statistical charts. In the specific implementation, we will use MySQL
 Steps to draw dashboard using ECharts and Python interface
Dec 18, 2023 am 08:40 AM
The steps to draw a dashboard using ECharts and Python interface require specific code examples. Summary: ECharts is an excellent data visualization tool that can easily perform data processing and graphics drawing through the Python interface. This article will introduce the specific steps to draw a dashboard using ECharts and Python interface, and provide sample code. Keywords: ECharts, Python interface, dashboard, data visualization Introduction Dashboard is a commonly used form of data visualization, which uses
 What is the name of Xianyu WeChat applet?
Feb 27, 2024 pm 01:11 PM
The official WeChat mini program of Xianyu has been quietly launched. It provides users with a convenient platform that allows you to easily publish and trade idle items. In the mini program, you can communicate with buyers or sellers via private messages, view personal information and orders, and search for the items you want. So what exactly is Xianyu called in the WeChat mini program? This tutorial guide will introduce it to you in detail. Users who want to know, please follow this article and continue reading! What is the name of the Xianyu WeChat applet? Answer: Xianyu, idle transactions, second-hand sales, valuations and recycling. 1. In the mini program, you can post idle messages, communicate with buyers/sellers via private messages, view personal information and orders, search for specified items, etc.; 2. On the mini program page, there are homepage, nearby, post idle, messages, and mine. 5 functions; 3.
 ECharts and golang technical guide: practical tips for creating various statistical charts
Dec 17, 2023 pm 09:56 PM
ECharts and golang technical guide: Practical tips for creating various statistical charts, specific code examples are required. Introduction: In the field of modern data visualization, statistical charts are an important tool for data analysis and visualization. ECharts is a powerful data visualization library, while golang is a fast, reliable and efficient programming language. This article will introduce you to how to use ECharts and golang to create various types of statistical charts, and provide code examples to help you master this skill. Preparation
 How to use histogram to display data in ECharts
Dec 18, 2023 pm 02:21 PM
How to use histograms to display data in ECharts ECharts is a JavaScript-based data visualization library that is very popular and widely used in the field of data visualization. Among them, the histogram is the most common and commonly used chart type, which can be used to display the size, comparison and trend analysis of various numerical data. This article will introduce how to use ECharts to draw histograms and provide code examples. First, we need to introduce the ECharts library into the HTML file, which can be introduced in the following way
 How to use map heat map to display city heat in ECharts
Dec 18, 2023 pm 04:00 PM
How to use a map heat map to display city heat in ECharts ECharts is a powerful visual chart library that provides various chart types for developers to use, including map heat maps. Map heat maps can be used to show the popularity of cities or regions, helping us quickly understand the popularity or density of different places. This article will introduce how to use the map heat map in ECharts to display city heat, and provide code examples for reference. First, we need a map file containing geographic information, EC


