 Development Tools
 VSCode
 Detailed explanation of how to debug Node.js programs more simply and effectively in vscode! !
Detailed explanation of how to debug Node.js programs more simply and effectively in vscode! !
This article will introduce to you a super simple method to use vscode to debug Node.js. It has certain reference value. Friends in need can refer to it. I hope it will be helpful to everyone.
Recommended learning: "vscode tutorial", "nodejs tutorial"
Let's Let's face it... debugging Node.js has always been a pain in the ass.
Getting to the pain points of debugging Node.js
If you have ever been lucky enough to write code for a Node.js project, Well you know what I'm talking about when I say debugging it to find what's going wrong isn't the easiest thing.
Unlike JavaScript in the browser, and unlike Java with a powerful IDE like IntelliJ, you cannot set breakpoints everywhere, refresh the page or restart the compiler, nor can you slowly review the code and inspect objects , evaluate functions, find variations or missing variables, etc. It's just too bad that you can't do that.
But Node.js can also be debugged, it just requires more effort. Let's discuss these options in detail and I'll show you the simplest debugging method I've encountered in my development experience.
Some alternative ways to debug Node.js
There are some ways to debug problematic Node.js programs. I've listed these methods (with detailed links) below. If you are interested, you can check it out.
-
Console.log()— If you’ve ever written JavaScript code, this trusty standby really needs no further explanation. It's built into Node.js and prints in the terminal, just like it's built into JavaScript and prints in the browser console.
In Java language, it is System.out.println(). In Python, it is print(). You see what I mean. This is the easiest to implement, and the fastest way to "dirty" clean code with extra lines of information - but it can (sometimes) also help you find and fix bugs.
-
Node.js Documentation
—-inspect— The Node.js documentation writers themselves understand that debugging is not easy, so they do some Handy reference to help people get started debugging.
This is useful, but honestly, it's not the easiest to decipher unless you've been writing programs for a while. They quickly got into the trap of UUIDs, WebSockets, and security vulnerabilities, and I started to feel overwhelmed. I thought to myself: There must be a less complicated way to do this.
- Chrome DevTools — Paul Irish wrote a blog post about using Chrome Developer Tools to debug Node.js in 2016 (and in 2018 renew). It looks pretty simple and is a big improvement for debugging.
After half an hour and I still haven't successfully connected the DevTools window to my simple Node program, I'm not so sure anymore. Maybe I just can't follow the instructions, but Chrome DevTools seems to make debugging more complicated than it should be.
- JetBrains — JetBrains is one of my favorite software development companies and one of the developers of IntelliJ and WebStorm. Their tools have a fantastic plugin ecosystem, and until recently, they were my go-to IDE.
With such a professional user base, there are many useful articles for debugging Node, but similar to the Node documentation and Chrome DevTools options, it's not easy. You have to create a debug configuration, attach a running process, and do a lot of configuration in the preferences before WebStorm is ready.
- Visual Studio Code — This is my new gold standard for Node debugging. I never thought I'd say this, but I'm totally invested in VS Code, and every new feature release the team makes makes me love this IDE even more.
VS Code does what all other options in Debugging Node.js fail to do, which makes it foolproof. If you want to get more advanced with your debugging, that's certainly possible, but they've broken it down simple enough that anyone can get up and running quickly, regardless of your proficiency with IDEs, Node, and programming. This is awesome.
Configuring VS Code to debug Node.js

Preferences > Settings and enter node debug in the search box. There should be an extension called Node debug under the Extensions tab. Click the first box here: Debug > Node: Auto Attach, and then set the drop-down box option to on. You are now almost done with the configuration. Yes, it's quite simple.

node --inspect in the terminal. Now look, something magical happened...
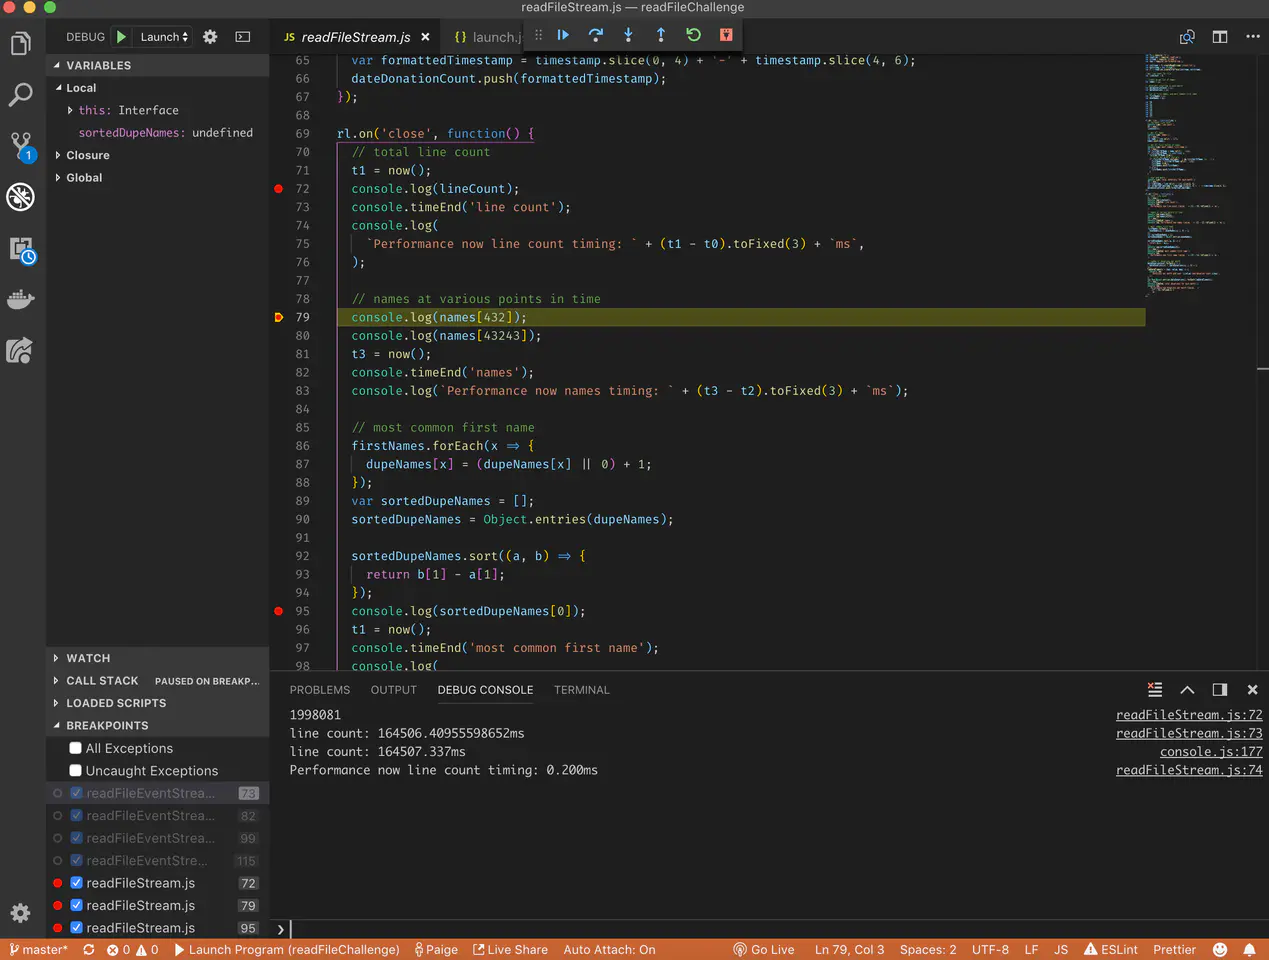
VS Code ongoing code debugging
If you need a Node .js project to test it, you can download my repo. It's meant to test different forms of transferring large amounts of data using Node, but it works great for this demo. When you hit theEnter key, the bottom of your VS Code terminal will turn orange, indicating that you are in debug mode, and your console will print something similar to Debugger Information about Attached.


console in the debug console at the bottom of VS Code .log, the yellow highlight will also move with it.
Summary
Debugging Node.js does not need to be as cumbersome as it used to be, nor does it need to include more than 500console.log## in the code base # to find out the location of the bug. Visual Studio Code's
setting makes this a thing of the past, and I'm very grateful for that. In a few weeks I will be writing some articles about end-to-end testing using Puppeteer and headless Chrome, or resetting passwords in the MERN app using Nodemailer, so follow me so you don’t miss out.
Thanks for reading, I hope this article can help you understand how to debug Node.js programs more easily and effectively with the help of VS Code. Thank you so much for the applause and for sharing my article!
Original address: https://itnext.io/the-absolute-easiest-way-to-debug-node-js-with-vscode-2e02ef5b1badProgramming VideoOriginal author: Paige Niedringhaus
Translation permanent link: https://github.com/xitu/gold-miner/blob/master/TODO1/the-absolute-easiest-way-to-debug-node-js-with- vscode.md
Translator: iceytea
For more programming-related knowledge, please visit:
The above is the detailed content of Detailed explanation of how to debug Node.js programs more simply and effectively in vscode! !. For more information, please follow other related articles on the PHP Chinese website!

Hot AI Tools

Undresser.AI Undress
AI-powered app for creating realistic nude photos

AI Clothes Remover
Online AI tool for removing clothes from photos.

Undress AI Tool
Undress images for free

Clothoff.io
AI clothes remover

Video Face Swap
Swap faces in any video effortlessly with our completely free AI face swap tool!

Hot Article

Hot Tools

Notepad++7.3.1
Easy-to-use and free code editor

SublimeText3 Chinese version
Chinese version, very easy to use

Zend Studio 13.0.1
Powerful PHP integrated development environment

Dreamweaver CS6
Visual web development tools

SublimeText3 Mac version
God-level code editing software (SublimeText3)

Hot Topics
 1662
1662
 14
14
 1419
1419
 52
52
 1312
1312
 25
25
 1262
1262
 29
29
 1235
1235
 24
24
 What computer configuration is required for vscode
Apr 15, 2025 pm 09:48 PM
VS Code system requirements: Operating system: Windows 10 and above, macOS 10.12 and above, Linux distribution processor: minimum 1.6 GHz, recommended 2.0 GHz and above memory: minimum 512 MB, recommended 4 GB and above storage space: minimum 250 MB, recommended 1 GB and above other requirements: stable network connection, Xorg/Wayland (Linux)
 How to define header files for vscode
Apr 15, 2025 pm 09:09 PM
How to define header files using Visual Studio Code? Create a header file and declare symbols in the header file using the .h or .hpp suffix name (such as classes, functions, variables) Compile the program using the #include directive to include the header file in the source file. The header file will be included and the declared symbols are available.
 vscode terminal usage tutorial
Apr 15, 2025 pm 10:09 PM
vscode built-in terminal is a development tool that allows running commands and scripts within the editor to simplify the development process. How to use vscode terminal: Open the terminal with the shortcut key (Ctrl/Cmd). Enter a command or run the script. Use hotkeys (such as Ctrl L to clear the terminal). Change the working directory (such as the cd command). Advanced features include debug mode, automatic code snippet completion, and interactive command history.
 Where to write code in vscode
Apr 15, 2025 pm 09:54 PM
Writing code in Visual Studio Code (VSCode) is simple and easy to use. Just install VSCode, create a project, select a language, create a file, write code, save and run it. The advantages of VSCode include cross-platform, free and open source, powerful features, rich extensions, and lightweight and fast.
 How to solve the problem of vscode Chinese annotations becoming question marks
Apr 15, 2025 pm 11:36 PM
How to solve the problem that Chinese comments in Visual Studio Code become question marks: Check the file encoding and make sure it is "UTF-8 without BOM". Change the font to a font that supports Chinese characters, such as "Song Style" or "Microsoft Yahei". Reinstall the font. Enable Unicode support. Upgrade VSCode, restart the computer, and recreate the source file.
 Common commands for vscode terminal
Apr 15, 2025 pm 10:06 PM
Common commands for VS Code terminals include: Clear the terminal screen (clear), list the current directory file (ls), change the current working directory (cd), print the current working directory path (pwd), create a new directory (mkdir), delete empty directory (rmdir), create a new file (touch) delete a file or directory (rm), copy a file or directory (cp), move or rename a file or directory (mv) display file content (cat) view file content and scroll (less) view file content only scroll down (more) display the first few lines of the file (head)
 vscode Previous Next Shortcut Key
Apr 15, 2025 pm 10:51 PM
VS Code One-step/Next step shortcut key usage: One-step (backward): Windows/Linux: Ctrl ←; macOS: Cmd ←Next step (forward): Windows/Linux: Ctrl →; macOS: Cmd →
 vscode terminal command cannot be used
Apr 15, 2025 pm 10:03 PM
Causes and solutions for the VS Code terminal commands not available: The necessary tools are not installed (Windows: WSL; macOS: Xcode command line tools) Path configuration is wrong (add executable files to PATH environment variables) Permission issues (run VS Code as administrator) Firewall or proxy restrictions (check settings, unrestrictions) Terminal settings are incorrect (enable use of external terminals) VS Code installation is corrupt (reinstall or update) Terminal configuration is incompatible (try different terminal types or commands) Specific environment variables are missing (set necessary environment variables)


