
 Web Front-end
Front-end Q&A
7 front-end debugging tools to quickly find bugs (essential for debugging)
Web Front-end
Front-end Q&A
7 front-end debugging tools to quickly find bugs (essential for debugging)
7 front-end debugging tools to quickly find bugs (essential for debugging)


Application vulnerabilities are the source of baldness for front-end debuggers. If you've been working on the front end, you know how difficult it is to fix application vulnerabilities.
Especially when using JavaScript, a small error can sometimes take hours to debug. However, vulnerabilities are inevitable across browsers, operating systems, and devices.
There are many tools for bugs, but not every one of them can be called a "bug nightmare". Some tools perform better than others. This article will introduce you to these little helpers for discovering, diagnosing and repairing vulnerabilities.
Web Browser Developer Tools
Any modern web browser comes with powerful tools to help you debug your application. It can be as simple as a console statement using console.log(), a popup window using alert(), or even a debugger statement to pause code execution. These tools are very useful in debugging tasks, especially debugger statements.
You can also use the network inspector or CSS styles inspector to make debugging easier and smoother. You can simply search on Google to learn more about your browser’s developer tools.
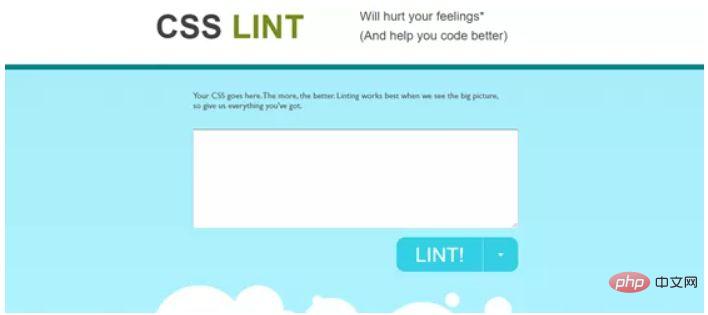
CSS Lint
CSS Lint tool can be used not only to verify code, but also to select Errors and warnings to detect. It performs basic syntax checking and applies a set of rules to the code, looking for problematic patterns or signs of inefficiency in the code.
The life of a programmer: 10K front-end interview preparation, the most complete interview question sharing (including answers)! zhuanlan.zhihu.com
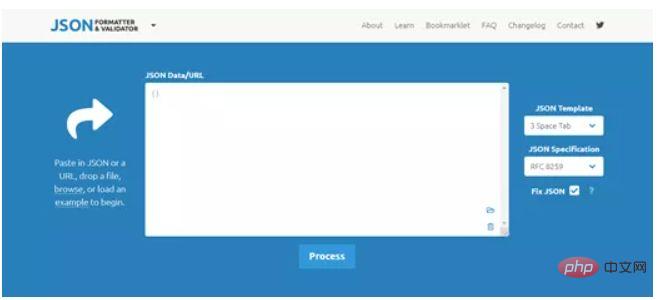
JSON formatting and verification tool
In unformatted JSON, it is difficult for us to find the syntax In case of errors or incorrect key values, as this is difficult to read. Reading and finding errors in compressed JSON files is more challenging when the JSON file is missing line returns and whitespace.
You need to be able to quickly scan the object and check for errors in formatting or content. If you expand each object and format it manually to fix this problem. This process will take up a lot of your valuable time.
You can use JSON formatting and validation tools to simply insert the compressed JSON and get a correctly formatted version as output. The tool can also validate JSON according to RFC standards.
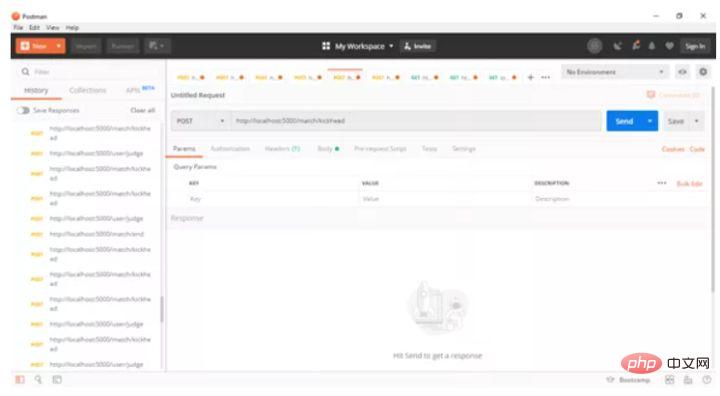
Postman
Almost all front-end applications send and receive JSON responses and requests. Apps connect to an API that can do many things such as authentication, user data transfer, and even simple things like getting current weather information for your location.
Postman is one of the best JS tools for debugging requests and responses. It also provides software for macOS systems, Windows systems, and Linux systems. It makes it fast and easy to send REST, SOAP and GraphQL requests directly.
Using Postman, you can adjust requests, analyze responses and fix vulnerability issues. It's useful when you're not sure whether the problem is on the front end or the back end.
sentry
Once an app is released, it is available on a variety of devices run. In any software development life cycle, the testing phase is implemented as a standard process. This phase includes unit testing, system testing, integration testing, etc.
However, there is always the possibility that you may overlook a vulnerability and allow it to continue in production. Even after release, you won't be aware of any remaining vulnerabilities without anyone notifying you. End users rarely report vulnerabilities via the provided email. This is where Sentry comes into play.
A cloud-based error logging system like Sentry can help you log error instances even after release. Sentry offers comprehensive solutions covering most available frameworks.
Sentry applicable languages and frameworks
BrowserStack
BrowserStack can help simulate The exact context in which the user encountered the error. A powerful combination of devices, operating systems, and browsers is an absolute must. You can make the most of it by using an error logging tool like Sentry.
When you log an error, you can reproduce the exact scenario by referencing the environment and recreating it in BrowserStack.
They offer lower prices for freelancers and free licenses for open source projects.

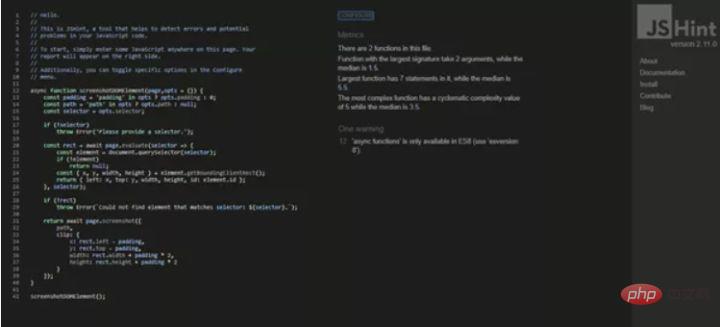
JSHint
This is a static code analysis that detects errors and potential problems in JS code Tools that can help developers find hard-to-find problems.
JSHint scans programs written in JavaScript and reports common errors and potential vulnerabilities, which may be syntax errors, vulnerabilities caused by implicit type conversion, leaked variables or some other problems.
The following is an example function I use to observe the operation of JSHint:
Hurry up and take a notebook to write down these artifacts for dealing with vulnerabilities!
This article is reproduced from: https://blog.csdn.net/lin123_00/article/details/106628193
For more related knowledge, please visit: PHP中文网!
The above is the detailed content of 7 front-end debugging tools to quickly find bugs (essential for debugging). For more information, please follow other related articles on the PHP Chinese website!

Hot AI Tools

Undresser.AI Undress
AI-powered app for creating realistic nude photos

AI Clothes Remover
Online AI tool for removing clothes from photos.

Undress AI Tool
Undress images for free

Clothoff.io
AI clothes remover

Video Face Swap
Swap faces in any video effortlessly with our completely free AI face swap tool!

Hot Article
Hot Tools

Notepad++7.3.1
Easy-to-use and free code editor

SublimeText3 Chinese version
Chinese version, very easy to use

Zend Studio 13.0.1
Powerful PHP integrated development environment

Dreamweaver CS6
Visual web development tools

SublimeText3 Mac version
God-level code editing software (SublimeText3)
Hot Topics


 How to use the chrono library in C?
Apr 28, 2025 pm 10:18 PM
How to use the chrono library in C?
Apr 28, 2025 pm 10:18 PM
Using the chrono library in C can allow you to control time and time intervals more accurately. Let's explore the charm of this library. C's chrono library is part of the standard library, which provides a modern way to deal with time and time intervals. For programmers who have suffered from time.h and ctime, chrono is undoubtedly a boon. It not only improves the readability and maintainability of the code, but also provides higher accuracy and flexibility. Let's start with the basics. The chrono library mainly includes the following key components: std::chrono::system_clock: represents the system clock, used to obtain the current time. std::chron
 How to optimize code
Apr 28, 2025 pm 10:27 PM
How to optimize code
Apr 28, 2025 pm 10:27 PM
C code optimization can be achieved through the following strategies: 1. Manually manage memory for optimization use; 2. Write code that complies with compiler optimization rules; 3. Select appropriate algorithms and data structures; 4. Use inline functions to reduce call overhead; 5. Apply template metaprogramming to optimize at compile time; 6. Avoid unnecessary copying, use moving semantics and reference parameters; 7. Use const correctly to help compiler optimization; 8. Select appropriate data structures, such as std::vector.
 How to measure thread performance in C?
Apr 28, 2025 pm 10:21 PM
How to measure thread performance in C?
Apr 28, 2025 pm 10:21 PM
Measuring thread performance in C can use the timing tools, performance analysis tools, and custom timers in the standard library. 1. Use the library to measure execution time. 2. Use gprof for performance analysis. The steps include adding the -pg option during compilation, running the program to generate a gmon.out file, and generating a performance report. 3. Use Valgrind's Callgrind module to perform more detailed analysis. The steps include running the program to generate the callgrind.out file and viewing the results using kcachegrind. 4. Custom timers can flexibly measure the execution time of a specific code segment. These methods help to fully understand thread performance and optimize code.
 How to use string streams in C?
Apr 28, 2025 pm 09:12 PM
How to use string streams in C?
Apr 28, 2025 pm 09:12 PM
The main steps and precautions for using string streams in C are as follows: 1. Create an output string stream and convert data, such as converting integers into strings. 2. Apply to serialization of complex data structures, such as converting vector into strings. 3. Pay attention to performance issues and avoid frequent use of string streams when processing large amounts of data. You can consider using the append method of std::string. 4. Pay attention to memory management and avoid frequent creation and destruction of string stream objects. You can reuse or use std::stringstream.
 What is real-time operating system programming in C?
Apr 28, 2025 pm 10:15 PM
What is real-time operating system programming in C?
Apr 28, 2025 pm 10:15 PM
C performs well in real-time operating system (RTOS) programming, providing efficient execution efficiency and precise time management. 1) C Meet the needs of RTOS through direct operation of hardware resources and efficient memory management. 2) Using object-oriented features, C can design a flexible task scheduling system. 3) C supports efficient interrupt processing, but dynamic memory allocation and exception processing must be avoided to ensure real-time. 4) Template programming and inline functions help in performance optimization. 5) In practical applications, C can be used to implement an efficient logging system.
 What is static analysis in C?
Apr 28, 2025 pm 09:09 PM
What is static analysis in C?
Apr 28, 2025 pm 09:09 PM
The application of static analysis in C mainly includes discovering memory management problems, checking code logic errors, and improving code security. 1) Static analysis can identify problems such as memory leaks, double releases, and uninitialized pointers. 2) It can detect unused variables, dead code and logical contradictions. 3) Static analysis tools such as Coverity can detect buffer overflow, integer overflow and unsafe API calls to improve code security.
 How to understand DMA operations in C?
Apr 28, 2025 pm 10:09 PM
How to understand DMA operations in C?
Apr 28, 2025 pm 10:09 PM
DMA in C refers to DirectMemoryAccess, a direct memory access technology, allowing hardware devices to directly transmit data to memory without CPU intervention. 1) DMA operation is highly dependent on hardware devices and drivers, and the implementation method varies from system to system. 2) Direct access to memory may bring security risks, and the correctness and security of the code must be ensured. 3) DMA can improve performance, but improper use may lead to degradation of system performance. Through practice and learning, we can master the skills of using DMA and maximize its effectiveness in scenarios such as high-speed data transmission and real-time signal processing.
 How to implement loosely coupled design in C?
Apr 28, 2025 pm 09:42 PM
How to implement loosely coupled design in C?
Apr 28, 2025 pm 09:42 PM
To implement loose coupling design in C, you can use the following methods: 1. Use interfaces, such as defining the Logger interface and implementing FileLogger and ConsoleLogger; 2. Dependency injection, such as the DataAccess class receives Database pointers through the constructor; 3. Observer mode, such as the Subject class notifies ConcreteObserver and AnotherObserver. Through these technologies, dependencies between modules can be reduced and code maintainability and flexibility can be improved.
