

How to use vscode debug

Visual Studio Code (hereinafter referred to as vscode) is a very powerful editor that is relatively lightweight. vscode supports three environments: windows, OS
vscode interface
The upper left corner is the project directory, search, version management git related (the lower left corner is the current branch), Debugging, other extension plug-ins, and others are all marked in Chinese without explanation. They are all necessary for us. If you don’t have these suggestions, call them out. These are some things that are very necessary for debugging. You can go to the view in the menu bar. Call out
debugging preconditions one by one: launch.json configuration
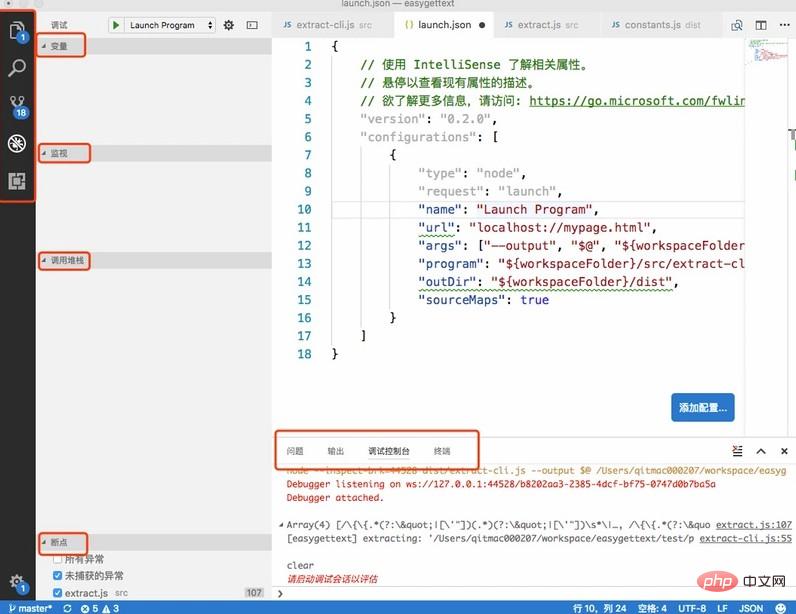
Click the fourth button from the left in the picture, which is debugging, and then click the red box in the picture You can open launch.json
    "configurations": [
        {
            "type": "node",
            "request": "launch",
            "name": "Launch Program",
            "program": "${workspaceFolder}/src/extract-cli.js",
            "args": ["--output", "output.pot", "${workspaceFolder}/test/product_group.vm"],
            "outDir": "${workspaceFolder}/dist",
            "sourceMaps": true
        }
]Type and request do not need to be changed, the default is fine. When request is launch, you can directly start debugging with F5. According to the official website explanation, request is attach and it is associated with an already running program, but You can ignore it here, we can just use the debugger that comes with vscode for debugging.
The program parameter specifies the js entry file to be run, where ${workspaceFolder} is the currently opened project directory. The .vscode directory will be automatically generated in this directory, and launch.json is also in this directory
args is also quite important. For example, in this example, I execute the command gettext-extract --output output.pot input.vm. Then the function of args is actually to pass in the parameters after the command. There must be a space between each space. Separate, written as a sub-element of args
sourceMaps This parameter is of little use for writing es5 code, but it is very necessary for writing es6, TypeScript, etc. When the value of this parameter is true, compilation will be used The map generated by the process corresponds to the source code and the compiled code, so that we can happily debug at the source code interruption point.
outDir is used to mark the generated directory of the compiled code. Help vscode search
Let’s discuss the correspondence between before and after compilation
I use babel to compile. After trying, if the program parameter points directly to the compiled file, vscode miraculously can find the source code file by itself, which is the easiest way for our debugging. If the program points to the file you wrote, then you need to provide an outDir parameter. Just configure it to the compilation and generation directory. . Others: Visual inspection does not require sourceMaps and compilation into .js.map. If you encounter problems while debugging, please try setting sourceMaps to true and let the compilation tool generate the map file
Debugging code
Just click on the left side of the code you are debugging. As long as it is red, it means that the breakpoint here is feasible, as shown in the picture

directly Press F5 to start debugging. Several single-step skips, single-step debugging, etc. similar to chrome will appear on the interface. The usage method is similar to chrome, but the shortcut keys are slightly different.
Then click left Click the debugging button introduced above, and you will see the variables running to a certain step, as well as the call stack, as shown in the figure

Others
Introducing the knowledge related to babel and command line entry used in this article
Open package.json, you will find a bin configuration, such a configuration will be displayed when npm install Add these two commands to node_modules/.bin, and then you can use it as a command line.
  "bin": {
    "gettext-compile": "./dist/compile-cli.js",
    "gettext-extract": "./dist/extract-cli.js"
}babel can add --source-maps true when executing the command to generate a map file. If you encounter the above This is only used when it comes to problems, and it is estimated that other compilation tools will also have it; in addition, after we modify the source file, we want to restart debugging immediately for verification. It is troublesome to execute the command by ourselves every time, so Babel itself supports-- The watch parameter can monitor file changes, so that we can implement simple automation. Babel or other command line commands are very long and difficult to remember, so we can write them in package.json. The following is about babel. To compile and write in it, you can execute npm run prepublish
  "scripts": {
    "prepublish": "babel  --watch --presets es2015 --plugins transform-object-assign --source-maps true src --out-dir dist/"
}Related recommendations: "vscode usage tutorial"
The above is the detailed content of How to use vscode debug. For more information, please follow other related articles on the PHP Chinese website!

Hot AI Tools

Undresser.AI Undress
AI-powered app for creating realistic nude photos

AI Clothes Remover
Online AI tool for removing clothes from photos.

Undress AI Tool
Undress images for free

Clothoff.io
AI clothes remover

Video Face Swap
Swap faces in any video effortlessly with our completely free AI face swap tool!

Hot Article
Hot Tools

Notepad++7.3.1
Easy-to-use and free code editor

SublimeText3 Chinese version
Chinese version, very easy to use

Zend Studio 13.0.1
Powerful PHP integrated development environment

Dreamweaver CS6
Visual web development tools

SublimeText3 Mac version
God-level code editing software (SublimeText3)
Hot Topics


 How to define header files for vscode
Apr 15, 2025 pm 09:09 PM
How to define header files for vscode
Apr 15, 2025 pm 09:09 PM
How to define header files using Visual Studio Code? Create a header file and declare symbols in the header file using the .h or .hpp suffix name (such as classes, functions, variables) Compile the program using the #include directive to include the header file in the source file. The header file will be included and the declared symbols are available.
 What computer configuration is required for vscode
Apr 15, 2025 pm 09:48 PM
What computer configuration is required for vscode
Apr 15, 2025 pm 09:48 PM
VS Code system requirements: Operating system: Windows 10 and above, macOS 10.12 and above, Linux distribution processor: minimum 1.6 GHz, recommended 2.0 GHz and above memory: minimum 512 MB, recommended 4 GB and above storage space: minimum 250 MB, recommended 1 GB and above other requirements: stable network connection, Xorg/Wayland (Linux)
 vscode terminal usage tutorial
Apr 15, 2025 pm 10:09 PM
vscode terminal usage tutorial
Apr 15, 2025 pm 10:09 PM
vscode built-in terminal is a development tool that allows running commands and scripts within the editor to simplify the development process. How to use vscode terminal: Open the terminal with the shortcut key (Ctrl/Cmd). Enter a command or run the script. Use hotkeys (such as Ctrl L to clear the terminal). Change the working directory (such as the cd command). Advanced features include debug mode, automatic code snippet completion, and interactive command history.
 Where to write code in vscode
Apr 15, 2025 pm 09:54 PM
Where to write code in vscode
Apr 15, 2025 pm 09:54 PM
Writing code in Visual Studio Code (VSCode) is simple and easy to use. Just install VSCode, create a project, select a language, create a file, write code, save and run it. The advantages of VSCode include cross-platform, free and open source, powerful features, rich extensions, and lightweight and fast.
 How to solve the problem of vscode Chinese annotations becoming question marks
Apr 15, 2025 pm 11:36 PM
How to solve the problem of vscode Chinese annotations becoming question marks
Apr 15, 2025 pm 11:36 PM
How to solve the problem that Chinese comments in Visual Studio Code become question marks: Check the file encoding and make sure it is "UTF-8 without BOM". Change the font to a font that supports Chinese characters, such as "Song Style" or "Microsoft Yahei". Reinstall the font. Enable Unicode support. Upgrade VSCode, restart the computer, and recreate the source file.
 Common commands for vscode terminal
Apr 15, 2025 pm 10:06 PM
Common commands for vscode terminal
Apr 15, 2025 pm 10:06 PM
Common commands for VS Code terminals include: Clear the terminal screen (clear), list the current directory file (ls), change the current working directory (cd), print the current working directory path (pwd), create a new directory (mkdir), delete empty directory (rmdir), create a new file (touch) delete a file or directory (rm), copy a file or directory (cp), move or rename a file or directory (mv) display file content (cat) view file content and scroll (less) view file content only scroll down (more) display the first few lines of the file (head)
 vscode terminal command cannot be used
Apr 15, 2025 pm 10:03 PM
vscode terminal command cannot be used
Apr 15, 2025 pm 10:03 PM
Causes and solutions for the VS Code terminal commands not available: The necessary tools are not installed (Windows: WSL; macOS: Xcode command line tools) Path configuration is wrong (add executable files to PATH environment variables) Permission issues (run VS Code as administrator) Firewall or proxy restrictions (check settings, unrestrictions) Terminal settings are incorrect (enable use of external terminals) VS Code installation is corrupt (reinstall or update) Terminal configuration is incompatible (try different terminal types or commands) Specific environment variables are missing (set necessary environment variables)
 vscode Previous Next Shortcut Key
Apr 15, 2025 pm 10:51 PM
vscode Previous Next Shortcut Key
Apr 15, 2025 pm 10:51 PM
VS Code One-step/Next step shortcut key usage: One-step (backward): Windows/Linux: Ctrl ←; macOS: Cmd ←Next step (forward): Windows/Linux: Ctrl →; macOS: Cmd →
