

HTML5's canvas implementation draws simple rectangles and triangles

This article mainly introduces the canvas implementation of HTML5 to draw simple rectangles and triangles. It has a certain reference value. Now I share it with you. Friends in need can refer to it.
There are two forms , one is stroke (fill), and the other is filling (stroke). The specific implementation code is as follows. Friends who are interested can refer to it. I hope it will be helpful to everyone.
First, place a canvas element in the html page, where the canvas element should have three attributes: ID, width, and height.
<canvas id="demo" width="600" height="600"></canvas>
Get the canvas object and get the context var cxt=document.getElementById('demo').getContext("2d"); where the parameter 2d is determined.
Start drawing. There are two forms, one is fill and the other is stroke.
javascript code:
<script language="javascript">
var cxt=document.getElementById('demo').getContext("2d");
cxt.beginPath();
cxt.fillStyle="#F00";/*设置填充颜色*/
cxt.fillRect(0,0,200,100);/*绘制一个矩形,前两个参数决定开始位置,后两个分别是矩形的宽和高*/
cxt.beginPath();
cxt.strokeStyle="#000";/*设置边框*/
cxt.lineWidth=3;/*边框的宽度*/
cxt.strokeRect(0,120,200,100);
cxt.beginPath();
cxt.moveTo(0,350);
cxt.lineTo(100,250);
cxt.lineTo(200,300);
cxt.closePath();/*可选步骤,关闭绘制的路径*/
cxt.stroke();
</script>Rendering: 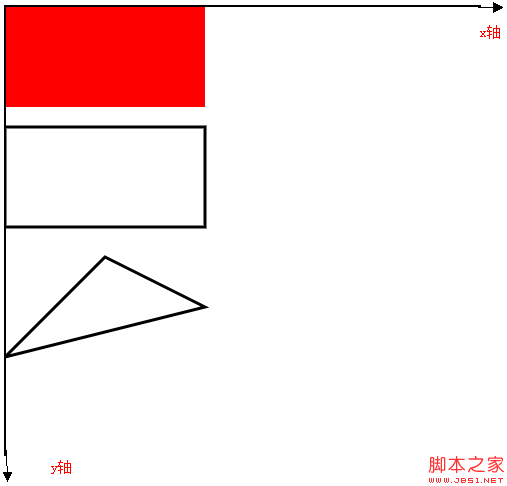
The above is the entire content of this article. I hope it will be helpful to everyone’s study. For more related content, please pay attention to the PHP Chinese website!
Related recommendations:
How to draw a polygon based on random points in canvas
The above is the detailed content of HTML5's canvas implementation draws simple rectangles and triangles. For more information, please follow other related articles on the PHP Chinese website!

Hot AI Tools

Undresser.AI Undress
AI-powered app for creating realistic nude photos

AI Clothes Remover
Online AI tool for removing clothes from photos.

Undress AI Tool
Undress images for free

Clothoff.io
AI clothes remover

Video Face Swap
Swap faces in any video effortlessly with our completely free AI face swap tool!

Hot Article
Hot Tools

Notepad++7.3.1
Easy-to-use and free code editor

SublimeText3 Chinese version
Chinese version, very easy to use

Zend Studio 13.0.1
Powerful PHP integrated development environment

Dreamweaver CS6
Visual web development tools

SublimeText3 Mac version
God-level code editing software (SublimeText3)
Hot Topics


 What is the area of a circle within a rectangle inscribed in a semicircle?
Sep 13, 2023 am 08:45 AM
What is the area of a circle within a rectangle inscribed in a semicircle?
Sep 13, 2023 am 08:45 AM
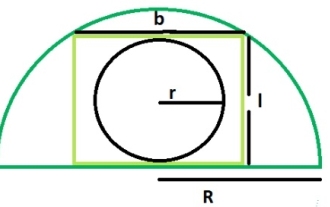
A circle inscribed in a rectangle is tangent to the longer side of the rectangle, that is, its length is tangent to the circle. A rectangle inscribed in a semicircle touches two points on the arc of the semicircle. The width of the rectangle is equal to the diameter of the circle. If R is the radius of the semicircle. The length of the rectangle = √2R/2 The width of the rectangle = R/√2 The radius of the inscribed circle is r = b/2 = R/2√2 Using this formula we can calculate the rectangle inscribed in the semicircle The area of a circle, area = (π*r2)=π*R/8 Example Demonstration #include<stdio.h>intmain(){&
 Java program to calculate the area of a triangle using determinants
Aug 31, 2023 am 10:17 AM
Java program to calculate the area of a triangle using determinants
Aug 31, 2023 am 10:17 AM
Introduction The Java program for calculating the area of a triangle using determinants is a concise and efficient program that can calculate the area of a triangle given the coordinates of three vertices. This program is useful for anyone learning or working with geometry, as it demonstrates how to use basic arithmetic and algebraic calculations in Java, as well as how to use the Scanner class to read user input. The program prompts the user for the coordinates of three points of the triangle, which are then read in and used to calculate the determinant of the coordinate matrix. Use the absolute value of the determinant to ensure the area is always positive, then use a formula to calculate the area of the triangle and display it to the user. The program can be easily modified to accept input in different formats or to perform additional calculations, making it a versatile tool for geometric calculations. ranks of determinants
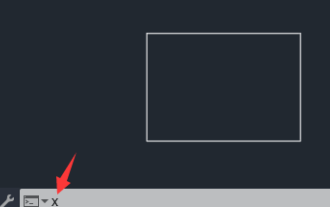 How to merge a graphic after CAD rectangles are scattered
Feb 28, 2024 pm 12:10 PM
How to merge a graphic after CAD rectangles are scattered
Feb 28, 2024 pm 12:10 PM
When using CAD software, we often encounter situations where we need to recombine "scattered" rectangular objects into a single graphic. This need arises in many fields, such as space planning, mechanical design and architectural drawings. In order to meet this demand, we need to understand and master some key functions in CAD software. Next, the editor of this website will introduce you in detail how to complete this task in the CAD environment. Users who have doubts can come and follow this article to learn. Method for merging CAD rectangles into one graphic after breaking them up: 1. Open the CAD2023 software, create a rectangle, and then enter the X command and a space. As shown below: 2. Select the rectangular object and space it. You can break up the objects. 3. Select all open lines
 Learn the canvas framework and explain the commonly used canvas framework in detail
Jan 17, 2024 am 11:03 AM
Learn the canvas framework and explain the commonly used canvas framework in detail
Jan 17, 2024 am 11:03 AM
Explore the Canvas framework: To understand what are the commonly used Canvas frameworks, specific code examples are required. Introduction: Canvas is a drawing API provided in HTML5, through which we can achieve rich graphics and animation effects. In order to improve the efficiency and convenience of drawing, many developers have developed different Canvas frameworks. This article will introduce some commonly used Canvas frameworks and provide specific code examples to help readers gain a deeper understanding of how to use these frameworks. 1. EaselJS framework Ea
 What are the canvas arrow plug-ins?
Aug 21, 2023 pm 02:14 PM
What are the canvas arrow plug-ins?
Aug 21, 2023 pm 02:14 PM
The canvas arrow plug-ins include: 1. Fabric.js, which has a simple and easy-to-use API and can create custom arrow effects; 2. Konva.js, which provides the function of drawing arrows and can create various arrow styles; 3. Pixi.js , which provides rich graphics processing functions and can achieve various arrow effects; 4. Two.js, which can easily create and control arrow styles and animations; 5. Arrow.js, which can create various arrow effects; 6. Rough .js, you can create hand-drawn arrows, etc.
 What are the details of the canvas clock?
Aug 21, 2023 pm 05:07 PM
What are the details of the canvas clock?
Aug 21, 2023 pm 05:07 PM
The details of the canvas clock include clock appearance, tick marks, digital clock, hour, minute and second hands, center point, animation effects, other styles, etc. Detailed introduction: 1. Clock appearance, you can use Canvas to draw a circular dial as the appearance of the clock, and you can set the size, color, border and other styles of the dial; 2. Scale lines, draw scale lines on the dial to represent hours or minutes. Position; 3. Digital clock, you can draw a digital clock on the dial to indicate the current hour and minute; 4. Hour hand, minute hand, second hand, etc.
 What versions of html2canvas are there?
Aug 22, 2023 pm 05:58 PM
What versions of html2canvas are there?
Aug 22, 2023 pm 05:58 PM
The versions of html2canvas include html2canvas v0.x, html2canvas v1.x, etc. Detailed introduction: 1. html2canvas v0.x, which is an early version of html2canvas. The latest stable version is v0.5.0-alpha1. It is a mature version that has been widely used and verified in many projects; 2. html2canvas v1.x, this is a new version of html2canvas.
 uniapp implements how to use canvas to draw charts and animation effects
Oct 18, 2023 am 10:42 AM
uniapp implements how to use canvas to draw charts and animation effects
Oct 18, 2023 am 10:42 AM
How to use canvas to draw charts and animation effects in uniapp requires specific code examples 1. Introduction With the popularity of mobile devices, more and more applications need to display various charts and animation effects on the mobile terminal. As a cross-platform development framework based on Vue.js, uniapp provides the ability to use canvas to draw charts and animation effects. This article will introduce how uniapp uses canvas to achieve chart and animation effects, and give specific code examples. 2. canvas
