

A brief introduction to the Node debugging tool tutorial
This article mainly introduces the introductory tutorial of Node debugging tools. Now I share it with you and give you a reference.
JavaScript programs are becoming more and more complex, and the importance of debugging tools has become increasingly prominent. Client scripts have browsers, how to debug Node scripts?

In 2016, Node decided to use the "Developer Tools" of the Chrome browser as the official debugging tool, so that Node scripts can also be debugged using the graphical interface, which is greatly convenient. Developer.
This article introduces how to use the debugging tool of Node script.
1. Sample program
For the convenience of explanation, the following is a sample script. First, create a new working directory and enter it.
$ mkdir debug-demo
$ cd debug-demo
Then, generate the package.json file and install the Koa framework and koa-route module.
$ npm init -y
$ npm install --save koa koa-route
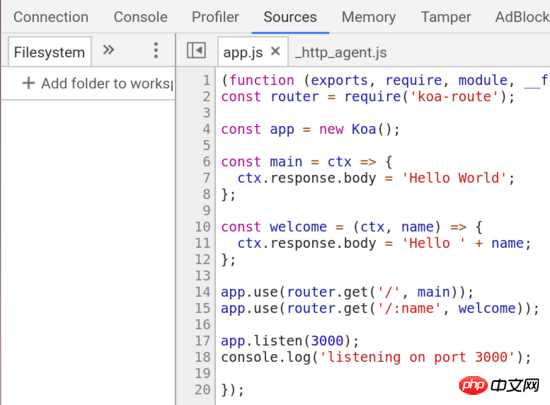
Next, create a new script app.js and write the following content.
// app.js
const Koa = require('koa');
const router = require('koa-route');
const app = new Koa();
const main = ctx => {
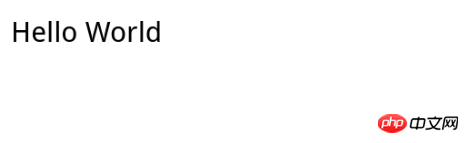
ctx.response.body = 'Hello World';
};
const welcome = (ctx, name) => {
ctx.response.body = 'Hello ' + name;
};
app.use(router.get('/', main));
app.use(router.get('/:name', welcome));
app.listen(3000);
console.log('listening on port 3000');The above code is a simple Web application that specifies two routes. After access, a line of welcome information will be displayed. If you want to know the detailed meaning of the code in detail, you can refer to the Koa tutorial.
2. Start the developer tools
Now, run the above script.
$ node --inspect app.js
In the above code, the --inspect parameter is required to start debugging mode. At this time, open the browser and visit http://127.0.0.1//3000, and you can see Hello World.
Next, it’s time to start debugging. There are two ways to open the debugging tool. The first is to type chrome://inspect or about:inspect in the address bar of the Chrome browser and press Enter. See the interface below.
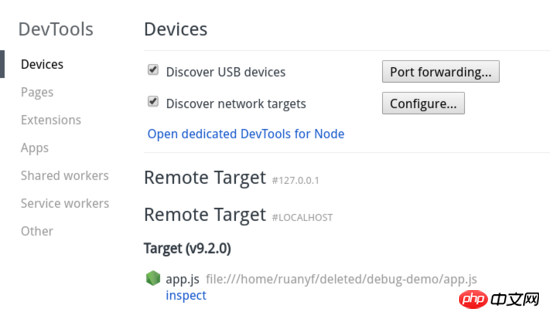
In the Target section, click the inspect link to enter the debugging tool.
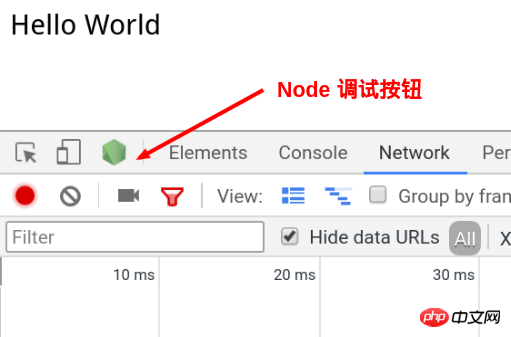
The second way to enter the debugging tool is to open the "Developer Tools" in the window at http://127.0.0.1//3000. There is a green Node logo in the upper left corner of the top. Click to enter. .
3. Debugging Tool Window
The debugging tool is actually a customized version of the "Developer Tools" , leaving out those parts that are not useful for server scripts.
It mainly has four panels.
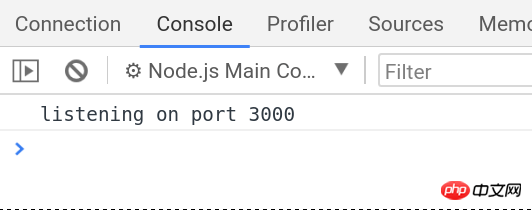
Console:Console
Memory:Memory
Profiler:Performance
Sources: Source code
The usage of these panels is basically similar to the browser environment. Only Sources is introduced here ( Source code) panel.
4. Set breakpoints
Enter the Sources panel and find the running script app.js.
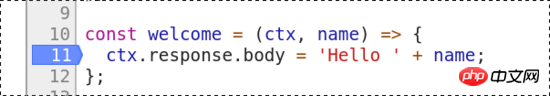
Click on the line number of line 11 (that is, the line below) to set a breakpoint.
ctx.response.body = 'Hello ' + name;
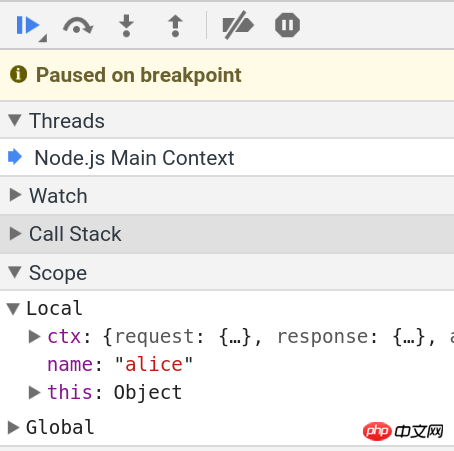
At this time, when the browser accesses http://127.0.0.1:3000/alice, the page will show that it is waiting for the server to return. Switch to the debugging tool and you can see that the Node main thread is in the paused stage.
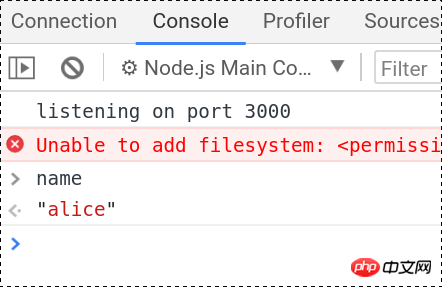
Enter the Console panel, enter name, and alice will be returned. This indicates that we are in the context of the breakpoint.
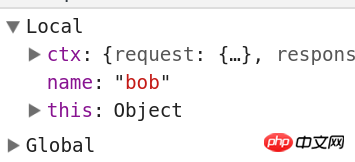
Switch back to the Sources panel, and you can see folding items such as Watch, Call Stack, Scope, and Breakpoints on the right. Open the Scope folding item and you can see all variables in the Local scope and Global scope. In the
Local scope, the value of the variable name is alice. Double-click to enter the editing state and change it to bob.
Then, click the Continue button on the top toolbar.
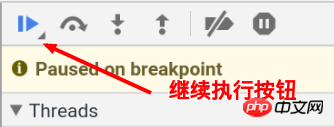
页面上就可以看到 Hello bob 了。

命令行下,按下 ctrl + c,终止运行 app.js 。
五、调试非服务脚本
Web 服务脚本会一直在后台运行,但是大部分脚本只是处理某个任务,运行完就会终止。这时,你可能根本没有时间打开调试工具。等你打开了,脚本早就结束运行了。这时怎么调试呢?
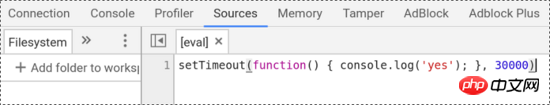
$ node --inspect=9229 -e "setTimeout(function() { console.log('yes'); }, 30000)"上面代码中, --inspect=9229 指定调试端口为 9229,这是调试工具默认的通信端口。 -e 参数指定一个字符串,作为代码运行。
访问 chrome://inspect ,就可以进入调试工具,调试这段代码了。
代码放在 setTimeout 里面,总是不太方便。那些运行时间较短的脚本,可能根本来不及打开调试工具。这时就要使用下面的方法。
$ node --inspect-brk=9229 app.js
上面代码中, --inspect-brk 指定在第一行就设置断点。也就是说,一开始运行,就是暂停的状态。
六、忘了写 --inspect 怎么办?
打开调试工具的前提是,启动 Node 脚本时就加上 --inspect 参数。如果忘了这个参数,还能不能调试呢?
回答是可以的。首先,正常启动脚本。
$ node app.js
然后,在另一个命令行窗口,查找上面脚本的进程号。
$ ps ax | grep app.js

30464 pts/11  Sl+  0:00 node app.js
30541 pts/12  S+   0:00 grep app.js
上面命令中, app.js 的进程号是 30464 。
接着,运行下面的命令。
$ node -e 'process._debugProcess(30464)'
上面命令会建立进程 30464 与调试工具的连接,然后就可以打开调试工具了。
还有一种方法,就是向脚本进程发送 SIGUSR1 信号,也可以建立调试连接。
$ kill -SIGUSR1 30464
上面是我整理给大家的,希望今后会对大家有帮助。
相关文章:
通过Ajax方式上传文件使用FormData进行Ajax请求
The above is the detailed content of A brief introduction to the Node debugging tool tutorial. For more information, please follow other related articles on the PHP Chinese website!

Hot AI Tools

Undresser.AI Undress
AI-powered app for creating realistic nude photos

AI Clothes Remover
Online AI tool for removing clothes from photos.

Undress AI Tool
Undress images for free

Clothoff.io
AI clothes remover

Video Face Swap
Swap faces in any video effortlessly with our completely free AI face swap tool!

Hot Article
Hot Tools

Notepad++7.3.1
Easy-to-use and free code editor

SublimeText3 Chinese version
Chinese version, very easy to use

Zend Studio 13.0.1
Powerful PHP integrated development environment

Dreamweaver CS6
Visual web development tools

SublimeText3 Mac version
God-level code editing software (SublimeText3)
Hot Topics
 1673
1673
 14
1428
52
1333
25
1277
29
1257
24
14
1428
52
1333
25
1277
29
1257
24

 How to register in the ok exchange in China? ok trading platform registration and use guide for beginners in mainland China
May 08, 2025 pm 10:51 PM
How to register in the ok exchange in China? ok trading platform registration and use guide for beginners in mainland China
May 08, 2025 pm 10:51 PM
In the cryptocurrency market, choosing a reliable trading platform is crucial. As a world-renowned digital asset exchange, the OK trading platform has attracted a large number of novice users in mainland China. This guide will introduce in detail how to register and use it on the OK trading platform to help novice users get started quickly.
 Binance binance web version entrance Binance binance exchange web version directly enter
May 08, 2025 pm 11:03 PM
Binance binance web version entrance Binance binance exchange web version directly enter
May 08, 2025 pm 11:03 PM
The world's leading cryptocurrency trading platform is famous for its efficient, secure and diverse trading services. Whether you are an experienced trader or a newbie into the cryptocurrency market, Binance has the tools and resources you need. Through Binance web version, users can easily access the trading platform without downloading any applications and conduct trading operations directly through the browser. This article will introduce in detail how to enter the Binance Binance Exchange web version and provide some practical trading tips and precautions.
 Yiou official website entrance Yiou exchange Apple entrance official entry
May 08, 2025 pm 11:12 PM
Yiou official website entrance Yiou exchange Apple entrance official entry
May 08, 2025 pm 11:12 PM
A world-renowned digital currency trading platform, established in 2014, is committed to providing users with safe and convenient digital asset trading services. As an international exchange, Yiou supports the transaction of a variety of mainstream and niche digital currencies, attracting users from all over the world. Whether newbies or experienced traders, you can find trading tools and services that suit you on the Yiou platform.
 How to enter the bull market in May 2025? Recommended on entry exchanges
May 12, 2025 pm 08:51 PM
How to enter the bull market in May 2025? Recommended on entry exchanges
May 12, 2025 pm 08:51 PM
Recommended exchanges for bull market in May 2025: 1. Binance; 2. OKX; 3. Huobi; 4. gate.io; 5. Sesame Open Door and other exchanges. The above exchanges are safe and reliable, and support a variety of currencies. This article provides detailed download portal addresses.
 Recommended for Bull Market Exchange in 2025
May 12, 2025 pm 08:45 PM
Recommended for Bull Market Exchange in 2025
May 12, 2025 pm 08:45 PM
Recommended exchanges for bull market in May 2025: 1. Binance; 2. OKX; 3. Huobi; 4. gate.io; 5. Sesame Open Door and other exchanges. The above exchanges are safe and reliable, and support a variety of currencies. This article provides detailed download portal addresses.
 The latest links for Ouyi okx platform official latest links
May 08, 2025 pm 10:57 PM
The latest links for Ouyi okx platform official latest links
May 08, 2025 pm 10:57 PM
As the world's leading digital asset trading platform, it has attracted a large number of investors and traders with its efficient, secure and user-friendly experience. Whether you are a first-time cryptocurrency market or an experienced trading expert, Ouyi OKX provides a wealth of trading tools and services to meet the needs of users at different levels. Recently, Ouyi OKX released the latest official link to ensure that users can access the platform safely and conveniently, conduct transactions and asset management.
 How to set, get and delete WordPress cookies (like a professional)
May 12, 2025 pm 08:57 PM
How to set, get and delete WordPress cookies (like a professional)
May 12, 2025 pm 08:57 PM
Do you want to know how to use cookies on your WordPress website? Cookies are useful tools for storing temporary information in users’ browsers. You can use this information to enhance the user experience through personalization and behavioral targeting. In this ultimate guide, we will show you how to set, get, and delete WordPresscookies like a professional. Note: This is an advanced tutorial. It requires you to be proficient in HTML, CSS, WordPress websites and PHP. What are cookies? Cookies are created and stored when users visit websites.
 How to add your WordPress site in Yandex Webmaster Tools
May 12, 2025 pm 09:06 PM
How to add your WordPress site in Yandex Webmaster Tools
May 12, 2025 pm 09:06 PM
Do you want to connect your website to Yandex Webmaster Tools? Webmaster tools such as Google Search Console, Bing and Yandex can help you optimize your website, monitor traffic, manage robots.txt, check for website errors, and more. In this article, we will share how to add your WordPress website to the Yandex Webmaster Tool to monitor your search engine traffic. What is Yandex? Yandex is a popular search engine based in Russia, similar to Google and Bing. You can excel in Yandex
