

Example sharing of drawing 3d pie chart with highCharts in Vue

This article mainly introduces you to an example of drawing a 3D pie chart in Vue with highCharts. Highcharts is a well-known foreign chart library based on JavaScript. Since the configuration of using highcharts in Vue on the Chinese official website is cumbersome and requires the introduction of jquery as a dependency, it is deprecated. Hope this article can help everyone.
Next, let me give you a brief introduction to the use and configuration of highcharts in vue.
首先使用 npm在你的项目中安装vue-highcharts

npm install vue-highcharts --save

由于vue-highcharts依赖于highcharts,我们还需要安装后者

npm install highcharts --save
After the installation is completed, enter the project main.js for configuration:
import highcharts from 'highcharts'
import VueHighCharts from 'vue-highcharts'

引入以上两项之后,因为我们需要使用3d图表,还需要引入:

import highcharts3d from 'highcharts/highcharts-3d'

调用3d图表:

highcharts3d(highcharts)
OK, so far highcharts has been configured in vue. Next, draw a 3d pie chart according to the API
Create a pie chart component:
<template>
<p class="container">
    <p :id="id" :option="option"></p>
</p>
</template>
<script>
import HighCharts from 'highcharts'
export default {
    props: {
        id: {
            type: String
        },
            //option 是图表的配置数据
        option: {
            type: Object
        }
    },
    mounted() {
        HighCharts.chart(this.id, this.option)
    }
}
</script>

<style scoped>
/* 容器 */
.container {
width: 1000px;
height: 550px;
}
</style>Configure the option data in the page where the pie chart needs to be used
<template>
<p class="charts">
<pie :id="id" :option="option"></pie>
</p>
</p>
</template>
<script>
import pie from '../components/pie'
import manes from '../components/list'
export default {
components: {
pie,
},
data() {
return {
id: 'test',
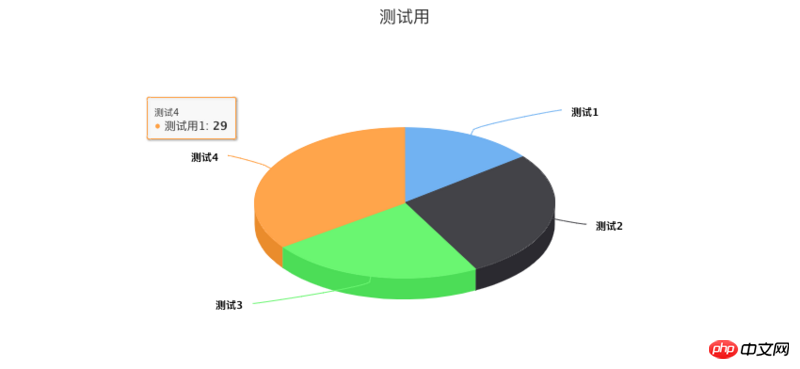
option: {
chart: {
type: 'pie',//饼图
options3d: {
enabled: true,//使用3d功能
alpha: 60,//延y轴向内的倾斜角度
beta: 0,
}
},
title: {
text: '测试用'//图表的标题文字
},
subtitle: {
text: ''//副标题文字
},
plotOptions: {
pie: {
allowPointSelect: true,//每个扇块能否选中
cursor: 'pointer',//鼠标指针
depth: 35,//饼图的厚度
dataLabels: {
enabled: true,//是否显示饼图的线形tip
}
}
},
series: [
{
type: 'pie',
name: '测试用1',//统一的前置词,非必须
data: [
['测试1',12],//模块名和所占比,也可以{name: '测试1',y: 12}
['测试2',23],
['测试3',19],
['测试4',29]
]
}
]
}
}
},
}
</script>
<style scoped>
</style>See the effect.
More configuration instructions can be viewed on the Chinese official website https://www.hcharts.cn/
Related recommendations:
How to use highcharts in angular
HighCharts draws 2D line chart with Label effect example sharing
The above is the detailed content of Example sharing of drawing 3d pie chart with highCharts in Vue. For more information, please follow other related articles on the PHP Chinese website!

Hot AI Tools

Undresser.AI Undress
AI-powered app for creating realistic nude photos

AI Clothes Remover
Online AI tool for removing clothes from photos.

Undress AI Tool
Undress images for free

Clothoff.io
AI clothes remover

Video Face Swap
Swap faces in any video effortlessly with our completely free AI face swap tool!

Hot Article
Hot Tools

Notepad++7.3.1
Easy-to-use and free code editor

SublimeText3 Chinese version
Chinese version, very easy to use

Zend Studio 13.0.1
Powerful PHP integrated development environment

Dreamweaver CS6
Visual web development tools

SublimeText3 Mac version
God-level code editing software (SublimeText3)
Hot Topics


 How to share Quark Netdisk to Baidu Netdisk?
Mar 14, 2024 pm 04:40 PM
How to share Quark Netdisk to Baidu Netdisk?
Mar 14, 2024 pm 04:40 PM
Quark Netdisk and Baidu Netdisk are very convenient storage tools. Many users are asking whether these two softwares are interoperable? How to share Quark Netdisk to Baidu Netdisk? Let this site introduce to users in detail how to save Quark network disk files to Baidu network disk. How to save files from Quark Network Disk to Baidu Network Disk Method 1. If you want to know how to transfer files from Quark Network Disk to Baidu Network Disk, first download the files that need to be saved on Quark Network Disk, and then open the Baidu Network Disk client. , select the folder where the compressed file is to be saved, and double-click to open the folder. 2. After opening the folder, click "Upload" in the upper left corner of the window. 3. Find the compressed file that needs to be uploaded on your computer and click to select it.
 How to share NetEase Cloud Music to WeChat Moments_Tutorial on sharing NetEase Cloud Music to WeChat Moments
Mar 25, 2024 am 11:41 AM
How to share NetEase Cloud Music to WeChat Moments_Tutorial on sharing NetEase Cloud Music to WeChat Moments
Mar 25, 2024 am 11:41 AM
1. First, we enter NetEase Cloud Music, and then click on the software homepage interface to enter the song playback interface. 2. Then in the song playback interface, find the sharing function button in the upper right corner, as shown in the red box in the figure below, click to select the sharing channel; in the sharing channel, click the "Share to" option at the bottom, and then select the first "WeChat Moments" allows you to share content to WeChat Moments.
 How to use Sankey chart to display data in Highcharts
Dec 17, 2023 pm 04:41 PM
How to use Sankey chart to display data in Highcharts
Dec 17, 2023 pm 04:41 PM
How to use Sankey diagram to display data in Highcharts Sankey diagram (SankeyDiagram) is a chart type used to visualize complex processes such as flow, energy, and funds. It can clearly display the relationship and flow between various nodes, and can help us better understand and analyze data. In this article, we will introduce how to use Highcharts to create and customize a Sankey chart, with specific code examples. First, we need to load the Highcharts library and Sank
 How to share files with friends on Baidu Netdisk
Mar 25, 2024 pm 06:52 PM
How to share files with friends on Baidu Netdisk
Mar 25, 2024 pm 06:52 PM
Recently, Baidu Netdisk Android client has ushered in a new version 8.0.0. This version not only brings many changes, but also adds many practical functions. Among them, the most eye-catching is the enhancement of the folder sharing function. Now, users can easily invite friends to join and share important files in work and life, achieving more convenient collaboration and sharing. So how do you share the files you need to share with your friends? Below, the editor of this site will give you a detailed introduction. I hope it can help you! 1) Open Baidu Cloud APP, first click to select the relevant folder on the homepage, and then click the [...] icon in the upper right corner of the interface; (as shown below) 2) Then click [+] in the "Shared Members" column 】, and finally check all
 How to use dynamic data in Highcharts to display real-time data
Dec 17, 2023 pm 06:57 PM
How to use dynamic data in Highcharts to display real-time data
Dec 17, 2023 pm 06:57 PM
How to use dynamic data in Highcharts to display real-time data. With the advent of the big data era, the display of real-time data has become more and more important. Highcharts, as a popular charting library, provides rich functions and customizability, allowing us to flexibly display real-time data. This article will introduce how to use dynamic data in Highcharts to display real-time data, and give specific code examples. First, we need to prepare a data source that can provide real-time data. In this article, I
 How to create a Gantt chart using Highcharts
Dec 17, 2023 pm 07:23 PM
How to create a Gantt chart using Highcharts
Dec 17, 2023 pm 07:23 PM
How to use Highcharts to create a Gantt chart requires specific code examples. Introduction: The Gantt chart is a chart form commonly used to display project progress and time management. It can visually display the start time, end time and progress of the task. Highcharts is a powerful JavaScript chart library that provides rich chart types and flexible configuration options. This article will introduce how to use Highcharts to create a Gantt chart and give specific code examples. 1. Highchart
 Mango tv member account sharing 2023
Feb 07, 2024 pm 02:27 PM
Mango tv member account sharing 2023
Feb 07, 2024 pm 02:27 PM
Mango TV has various types of movies, TV series, variety shows and other resources, and users can freely choose to watch them. Mango TV members can not only watch all VIP dramas, but also set the highest definition picture quality to help users watch dramas happily. Below, the editor will bring you some free Mango TV membership accounts for users to use, hurry up and take a look Take a look. Mango TV latest member account free sharing 2023: Note: These are the latest member accounts collected, you can log in directly and use them, do not change the password at will. Account number: 13842025699 Password: qds373 Account number: 15804882888 Password: evr6982 Account number: 13330925667 Password: jgqae Account number: 1703
 How to use stacked charts to display data in Highcharts
Dec 18, 2023 pm 05:56 PM
How to use stacked charts to display data in Highcharts
Dec 18, 2023 pm 05:56 PM
How to use stacked charts to display data in Highcharts Stacked charts are a common way of visualizing data, which can display the sum of multiple data series at the same time and display the contribution of each data series in the form of a bar chart. Highcharts is a powerful JavaScript library that provides a rich variety of charts and flexible configuration options to meet various data visualization needs. In this article, we will introduce how to use Highcharts to create a stacked chart and provide
