

Introduction to basic usage of echart plug-in and so on
This article mainly introduces the introduction of echart. The editor thinks it is quite good. Now I will share it with you and give you a reference. Let’s follow the editor to take a look
1. Download the plug-in
The following is the download link for ECharts. It should be noted that ECharts also relies on Another plug-in is called ZRender. Of course, ZRender is not required for most charts, but ZRender is required for map controls and other complex rendering controls. In order to avoid unnecessary problems, it is recommended that you also download ZRender when downloading ECharts.
ECharts download address: http://echarts.baidu.com/
ZRender download address: http://ecomfe.github.io/zrender/index. html
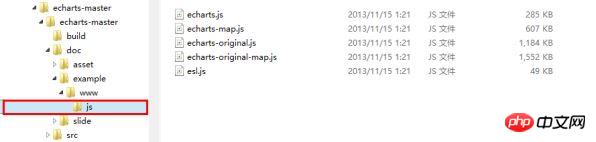
After downloading, unzip the respective file directory structures as follows:
ECharts:
ZRender:

##2. Plug-in reference

- All files related to ECharts are in the echarts folder
- The contents of the echarts folder are divided into two Part

3. Specific use in the page
MapChart
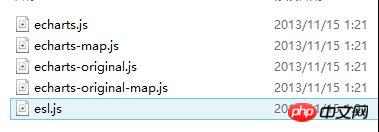
Add a reference to echarts in the head tag as follows:
<head runat="server">
  <title></title>
  <script src="echarts/esl.js" type="text/javascript"></script>
</head>
<body>

<p id="main"style="height:500px;border:1px solid #ccc;padding:10px;"></p>

……………

……………

</body>
<script type="text/javascript">
//为模块加载器配置echarts的路径,这里主要是配置map图表的路径,其他的图表跟map的配置还不太一样,下边也会做另一种类型的图表事例。
这里引用的主要是echarts文件夹下的echarts-map文件,而其他类型的图表引用的都是echarts文件夹下的echarts文件。
require.config({
paths: {
echarts:'./echarts/echarts',
'echarts/chart/map':'./echarts/echarts-map'
}
});
//动态加载echarts,在回掉函数中使用,要注意保持按需加载结构定义图表路径
require(
[
'echarts',
'echarts/chart/map'
],
function (ec) {
varmyChart=ecinit(documentgetElementById('main'));
//option主要是图标的一些设置,这不是这篇文章的重点,关于具体的设置可以参考官方的文档说明文档
option= {
title: {
text:'iphone销量',
subtext:'纯属虚构',
x:'center'
},
tooltip: {
trigger:'item'
},
legend: {
orient:'vertical',
x:'left',
data: ['iphone3','iphone4','iphone5']
},
dataRange: {
min:0,
max:2500,
text: ['高','低'],
calculable:true,
textStyle: {
color:'orange'
}
},
toolbox: {
show:true,
orient:'vertical',
x:'right',
y:'center',
feature: {
mark:true,
dataView: { readOnly:false },
restore:true,
saveAsImage:true
}
},
series: [
{
name:'iphone3',
type:'map',
mapType:'china',
selectedMode: 'single',
itemStyle: {
normal: { label: { show:true },color:'#ffd700' },// for legend
emphasis: { label: { show:true} }
},
data: [
{ name:'北京',value:Math.round(Math.random() *1000) },
{ name:'天津',value:Math.round(Math.random() *1000) },
{ name:'上海',value:Math.round(Math.random() *1000) },
{ name:'重庆',value:Math.round(Math.random() *1000) },
{ name:'河北',value:Math.round(Math.random() *1000) },
{ name:'河南',value:Math.round(Math.random() *1000) },
{ name:'云南',value:Math.round(Math.random() *1000) },
{ name:'辽宁',value:Math.round(Math.random() *1000) },
{ name:'黑龙江',value:Math.round(Math.random() *1000) },
{ name:'湖南',value:Math.round(Math.random() *1000) },
{ name:'安徽',value:Math.round(Math.random() *1000) },
{ name:'山东',value:Math.round(Math.random() *1000) },
{ name:'新疆',value:Math.round(Math.random() *1000) },
{ name:'江苏',value:Math.round(Math.random() *1000) },
{ name:'浙江',value:Math.round(Math.random() *1000) },
{ name:'江西',value:Math.round(Math.random() *1000) },
{ name:'湖北',value:Math.round(Math.random() *1000) },
{ name:'广西',value:Math.round(Math.random() *1000) },
{ name:'甘肃',value:Math.round(Math.random() *1000) },
{ name:'山西',value:Math.round(Math.random() *1000) },
{ name:'内蒙古',value:Math.round(Math.random() *1000) },
{ name:'陕西',value:Math.round(Math.random() *1000) },
{ name:'吉林',value:Math.round(Math.random() *1000) },
{ name:'福建',value:Math.round(Math.random() *1000) },
{ name:'贵州',value:Math.round(Math.random() *1000) },
{ name:'广东',value:Math.round(Math.random() *1000) },
{ name:'青海',value:Math.round(Math.random() *1000) },
{ name:'西藏',value:Math.round(Math.random() *1000) },
{ name:'四川',value:Math.round(Math.random() *1000) },
{ name:'宁夏',value:Math.round(Math.random() *1000) },
{ name:'海南',value:Math.round(Math.random() *1000) },
{ name:'台湾',value:Math.round(Math.random() *1000) },
{ name:'香港',value:Math.round(Math.random() *1000) },
{ name:'澳门',value:Math.round(Math.random() *1000) }
]
},
{
name:'iphone4',
type:'map',
mapType:'china',
selectedMode: 'single',
itemStyle: {
normal: { label: { show:true },color:'#ff8c00' },// for legend
emphasis: { label: { show:true} }
},
data: [
{ name:'北京',value:Math.round(Math.random() *1000) },
{ name:'天津',value:Math.round(Math.random() *1000) },
{ name:'上海',value:Math.round(Math.random() *1000) },
{ name:'重庆',value:Math.round(Math.random() *1000) },
{ name:'河北',value:Math.round(Math.random() *1000) },
{ name:'安徽',value:Math.round(Math.random() *1000) },
{ name:'新疆',value:Math.round(Math.random() *1000) },
{ name:'浙江',value:Math.round(Math.random() *1000) },
{ name:'江西',value:Math.round(Math.random() *1000) },
{ name:'山西',value:Math.round(Math.random() *1000) },
{ name:'内蒙古',value:Math.round(Math.random() *1000) },
{ name:'吉林',value:Math.round(Math.random() *1000) },
{ name:'福建',value:Math.round(Math.random() *1000) },
{ name:'广东',value:Math.round(Math.random() *1000) },
{ name:'西藏',value:Math.round(Math.random() *1000) },
{ name:'四川',value:Math.round(Math.random() *1000) },
{ name:'宁夏',value:Math.round(Math.random() *1000) },
{ name:'香港',value:Math.round(Math.random() *1000) },
{ name:'澳门',value:Math.round(Math.random() *1000) }
]
},
{
name:'iphone5',
type:'map',
mapType:'china',
selectedMode: 'single',
itemStyle: {
normal: { label: { show:true },color:'#da70d6' },// for legend
emphasis: { label: { show:true} }
},
data: [
{ name:'北京',value:Math.round(Math.random() *1000) },
{ name:'天津',value:Math.round(Math.random() *1000) },
{ name:'上海',value:Math.round(Math.random() *1000) },
{ name:'广东',value:Math.round(Math.random() *1000) },
{ name:'台湾',value:Math.round(Math.random() *1000) },
{ name:'香港',value:Math.round(Math.random() *1000) },
{ name:'澳门',value:Math.round(Math.random() *1000) }
]
}
]
};
//以下的这段代码主要是用来处理用户的选择,应用场景是可以做地图的交互,比如点击地图上的某一个省,获取相应的省的指标变化等。
//需要特别注意的是,如果需要点击某一省作地图的操作交互的话,还需要为series属性的每一项添加一个selectedMode属性,这里的属性值为 'single'即单选,也可多选
varecConfig= require('echarts/config');
myChart.on(ecConfig.EVENT.MAP_SELECTED,function (param) {
varselected=param.selected;
varmapSeries=option.series[0];
vardata= [];
varlegendData= [];
varname;
for (varp=0,len=mapSeries.data.length; p<len; p++) {
name=mapSeries.data[p].name;
mapSeries.data[p].selected=selected[name];
if (selected[name]) {
alert(name); //这里只是简单的做一个事例说明,弹出用户所选的省,如需做其他的扩展,可以在这里边添加相应的操作
}
}
});
myChart.setOption(option);
}
);
</script> 
LineChart
<scripttype="text/javascript">
require.config({
paths: {
echarts:'./echarts/echarts',
'echarts/chart/bar':'./echarts/echarts',//这里需要注意的是除了mapchart使用的配置文件为echarts-map之外,
其他的图形引用的配置文件都为echarts,这也是一般的图形跟地图的区别
'echarts/chart/line':'./echarts/echarts'
}
});
require(
[
'echarts',
'echarts/chart/bar',
'echarts/chart/line'
],
function (ec) {
varmyChart=ecinit(documentgetElementById('main'));
option= {
tooltip: {
trigger:'axis'
},
legend: {
data: ['邮件营销','联盟广告','视频广告','直接问','搜索引擎']
},
toolbox: {
show:true,
feature: {
mark:true,
dataView: { readOnly:false },
magicType: ['line','bar'],
restore:true,
saveAsImage:true
}
},
calculable:true,
xAxis: [
{
type:'category',
boundaryGap:false,
data: ['周一','周二','周三','周四','周五','周六','周日']
}
],
yAxis: [
{
type:'value',
splitArea: { show:true }
}
],
series: [
{
name:'邮件营销',
type:'line',
stack:'总量',
data: [120,132,101,134,90,230,210]
},
{
name:'联盟广告',
type:'line',
stack:'总量',
data: [220,182,191,234,290,330,310]
},
{
name:'视频广告',
type:'line',
stack:'总量',
data: [150,232,201,154,190,330,410]
},
{
name:'直接访问',
type:'line',
stack:'总量',
data: [320,332,301,334,390,330,320]
},
{
name:'搜索引擎',
type:'line',
stack:'总量',
data: [820,932,901,934,1290,1330,1320]
}
]
};
myChart.setOption(option);
}
);
</script>
<pid="main1"style="height:500px;border:1px solid #ccc;padding:10px;"></p>
<scripttype="text/javascript">
require.config({
paths: {
echarts:'./echarts/echarts',
'echarts/chart/bar':'./echarts/echarts',
'echarts/chart/line':'./echarts/echarts'
}
});
require(
[
'echarts',
'echarts/chart/bar',
'echarts/chart/line'
],
function (ec) {
varmyChart=ecinit(documentgetElementById('main1'));
option= {
title: {
text:'未来一周气温变化',
subtext:'纯属虚构'
},
tooltip: {
trigger:'axis'
},
legend: {
data: ['最高气温'最低气温']
},
toolbox: {
show:true,
feature: {
mark:true,
dataView: { readOnly:false },
magicType: ['line','bar'],
restore:true,
saveAsImage:true
}
},
calculable:true,
xAxis: [
{
type:'category',
boundaryGap:false,
data: ['周一','周二','周三','周四','周五','周六','周日']
}
],
yAxis: [
{
type:'value',
axisLabel: {
formatter:'{value} '
},
splitArea: { show:true }
}
],
series: [
{
name:'最高气温',
type:'line',
itemStyle: {
normal: {
lineStyle: {
shadowColor:'rgba(0,0,0,4)'
}
}
},
data: [11,11,15,13,12,13,10]
},
{
name:'最低气温',
type:'line',
itemStyle: {
normal: {
lineStyle: {
shadowColor:'rgba(0,0,0,4)'
}
}
},
data: [-2,1,2,5,3,2,0]
}
]
};
myChart.setOption(option);
}
);
</script>
<pid="main2"style="height:500px;border:1px solid #ccc;padding:10px;"></p>
<scripttype="text/javascript">
require.config({
paths: {
echarts:'./echarts/echarts',
'echarts/chart/bar':'./echarts/echarts',
'echarts/chart/line':'./echarts/echarts'
}
});
require(
[
'echarts',
'echarts/chart/bar',
'echarts/chart/line'
],
function (ec) {
varmyChart=ec.init(document.getElementById('main2'));
option= {
title: {
text:'某楼盘销售情况',
subtext:'纯属虚构'
},
tooltip: {
trigger:'axis'
},
legend: {
data: ['意向','预购','成交']
},
toolbox: {
show:true,
feature: {
mark:true,
dataView: { readOnly:false },
magicType: ['line','bar'],
restore:true,
saveAsImage:true
}
},
calculable:true,
xAxis: [
{
type:'category',
boundaryGap:false,
data: ['周','周二','周三','周四','周五','周六','周日']
}
],
yAxis: [
{
type:'value'
}
],
series: [
{
name:'成交',
type:'line',
smooth:true,
itemStyle: { normal: { areaStyle: { type:'default'}} },
data: [10,12,21,54,260,830,710]
},
{
name:'预购',
type:'line',
smooth:true,
itemStyle: { normal: { areaStyle: { type:'default'}} },
data: [30,182,434,791,390,30,10]
},
{
name:'意向',
type:'line',
smooth:true,
itemStyle: { normal: { areaStyle: { type:'default'}} },
data: [1320,1132,601,234,120,90,20]
}
]
};
myChart.setOption(option);
}
);
</script>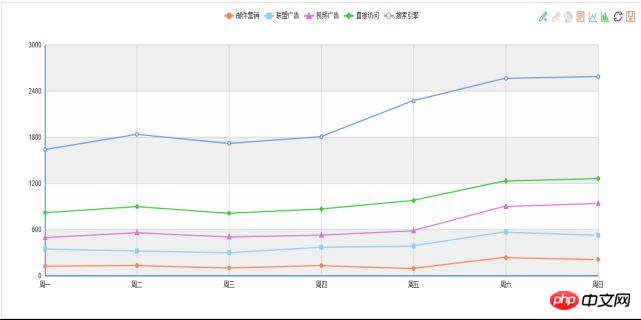
The above is the detailed content of Introduction to basic usage of echart plug-in and so on. For more information, please follow other related articles on the PHP Chinese website!

Hot AI Tools

Undresser.AI Undress
AI-powered app for creating realistic nude photos

AI Clothes Remover
Online AI tool for removing clothes from photos.

Undress AI Tool
Undress images for free

Clothoff.io
AI clothes remover

Video Face Swap
Swap faces in any video effortlessly with our completely free AI face swap tool!

Hot Article
Hot Tools

Notepad++7.3.1
Easy-to-use and free code editor

SublimeText3 Chinese version
Chinese version, very easy to use

Zend Studio 13.0.1
Powerful PHP integrated development environment

Dreamweaver CS6
Visual web development tools

SublimeText3 Mac version
God-level code editing software (SublimeText3)
Hot Topics
 1666
1666
 14
1425
52
1327
25
1273
29
1252
24
14
1425
52
1327
25
1273
29
1252
24

 How to use mdf and mds files
Feb 19, 2024 pm 05:36 PM
How to use mdf and mds files
Feb 19, 2024 pm 05:36 PM
How to use mdf files and mds files With the continuous advancement of computer technology, we can store and share data in a variety of ways. In the field of digital media, we often encounter some special file formats. In this article, we will discuss a common file format - mdf and mds files, and introduce how to use them. First, we need to understand the meaning of mdf files and mds files. mdf is the extension of the CD/DVD image file, and the mds file is the metadata file of the mdf file.
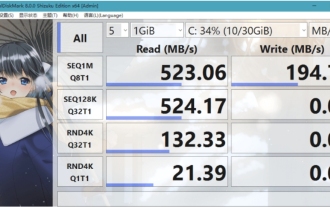 What software is crystaldiskmark? -How to use crystaldiskmark?
Mar 18, 2024 pm 02:58 PM
What software is crystaldiskmark? -How to use crystaldiskmark?
Mar 18, 2024 pm 02:58 PM
CrystalDiskMark is a small HDD benchmark tool for hard drives that quickly measures sequential and random read/write speeds. Next, let the editor introduce CrystalDiskMark to you and how to use crystaldiskmark~ 1. Introduction to CrystalDiskMark CrystalDiskMark is a widely used disk performance testing tool used to evaluate the read and write speed and performance of mechanical hard drives and solid-state drives (SSD). Random I/O performance. It is a free Windows application and provides a user-friendly interface and various test modes to evaluate different aspects of hard drive performance and is widely used in hardware reviews
 How to download foobar2000? -How to use foobar2000
Mar 18, 2024 am 10:58 AM
How to download foobar2000? -How to use foobar2000
Mar 18, 2024 am 10:58 AM
foobar2000 is a software that can listen to music resources at any time. It brings you all kinds of music with lossless sound quality. The enhanced version of the music player allows you to get a more comprehensive and comfortable music experience. Its design concept is to play the advanced audio on the computer The device is transplanted to mobile phones to provide a more convenient and efficient music playback experience. The interface design is simple, clear and easy to use. It adopts a minimalist design style without too many decorations and cumbersome operations to get started quickly. It also supports a variety of skins and Theme, personalize settings according to your own preferences, and create an exclusive music player that supports the playback of multiple audio formats. It also supports the audio gain function to adjust the volume according to your own hearing conditions to avoid hearing damage caused by excessive volume. Next, let me help you
 BTCC tutorial: How to bind and use MetaMask wallet on BTCC exchange?
Apr 26, 2024 am 09:40 AM
BTCC tutorial: How to bind and use MetaMask wallet on BTCC exchange?
Apr 26, 2024 am 09:40 AM
MetaMask (also called Little Fox Wallet in Chinese) is a free and well-received encryption wallet software. Currently, BTCC supports binding to the MetaMask wallet. After binding, you can use the MetaMask wallet to quickly log in, store value, buy coins, etc., and you can also get 20 USDT trial bonus for the first time binding. In the BTCCMetaMask wallet tutorial, we will introduce in detail how to register and use MetaMask, and how to bind and use the Little Fox wallet in BTCC. What is MetaMask wallet? With over 30 million users, MetaMask Little Fox Wallet is one of the most popular cryptocurrency wallets today. It is free to use and can be installed on the network as an extension
 How to use NetEase Mailbox Master
Mar 27, 2024 pm 05:32 PM
How to use NetEase Mailbox Master
Mar 27, 2024 pm 05:32 PM
NetEase Mailbox, as an email address widely used by Chinese netizens, has always won the trust of users with its stable and efficient services. NetEase Mailbox Master is an email software specially created for mobile phone users. It greatly simplifies the process of sending and receiving emails and makes our email processing more convenient. So how to use NetEase Mailbox Master, and what specific functions it has. Below, the editor of this site will give you a detailed introduction, hoping to help you! First, you can search and download the NetEase Mailbox Master app in the mobile app store. Search for "NetEase Mailbox Master" in App Store or Baidu Mobile Assistant, and then follow the prompts to install it. After the download and installation is completed, we open the NetEase email account and log in. The login interface is as shown below
 How to use Baidu Netdisk app
Mar 27, 2024 pm 06:46 PM
How to use Baidu Netdisk app
Mar 27, 2024 pm 06:46 PM
Cloud storage has become an indispensable part of our daily life and work nowadays. As one of the leading cloud storage services in China, Baidu Netdisk has won the favor of a large number of users with its powerful storage functions, efficient transmission speed and convenient operation experience. And whether you want to back up important files, share information, watch videos online, or listen to music, Baidu Cloud Disk can meet your needs. However, many users may not understand the specific use method of Baidu Netdisk app, so this tutorial will introduce in detail how to use Baidu Netdisk app. Users who are still confused can follow this article to learn more. ! How to use Baidu Cloud Network Disk: 1. Installation First, when downloading and installing Baidu Cloud software, please select the custom installation option.
 How to use Thunder to download magnet links
Feb 25, 2024 pm 12:51 PM
How to use Thunder to download magnet links
Feb 25, 2024 pm 12:51 PM
With the rapid development of network technology, our lives have also been greatly facilitated, one of which is the ability to download and share various resources through the network. In the process of downloading resources, magnet links have become a very common and convenient download method. So, how to use Thunder magnet links? Below, I will give you a detailed introduction. Xunlei is a very popular download tool that supports a variety of download methods, including magnet links. A magnet link can be understood as a download address through which we can obtain relevant information about resources.
 Teach you how to use the new advanced features of iOS 17.4 'Stolen Device Protection'
Mar 10, 2024 pm 04:34 PM
Teach you how to use the new advanced features of iOS 17.4 'Stolen Device Protection'
Mar 10, 2024 pm 04:34 PM
Apple rolled out the iOS 17.4 update on Tuesday, bringing a slew of new features and fixes to iPhones. The update includes new emojis, and EU users will also be able to download them from other app stores. In addition, the update also strengthens the control of iPhone security and introduces more "Stolen Device Protection" setting options to provide users with more choices and protection. "iOS17.3 introduces the "Stolen Device Protection" function for the first time, adding extra security to users' sensitive information. When the user is away from home and other familiar places, this function requires the user to enter biometric information for the first time, and after one hour You must enter information again to access and change certain data, such as changing your Apple ID password or turning off stolen device protection.
