

How to create cool charts using Vue.js and Chart.js
#Learn more about chart.js options to create beautiful charts. Interactive charts can provide a cool way to visualize your data. But most out-of-the-box solutions don't produce very beautiful charts with the default options.
In this article, I will teach you how to customize chart.js options to create cool charts.
⚡ Quick Start
We need:
Vue.js
vue-chart.js
vue-cli
Use vue-cli to build the basic structure. I hope you have installed it. We use vue-chart.js as the packager of chart.js.
vue init webpack awesome-charts
Then go to the project directory to install the dependencies:
cd awesome-charts && yarn install
Add vue-chartjs:
yarn add vue-chartjs -S
The first chart
Now let’s create the first A discount table.
touch src/components/LineChart.js && subl .
Now we need to import the base table of the polyline table from vue-chartjs and create the component.
Use the data and options we prepared in the mount() function to call the renderChart() method.
import {Line} from 'vue-chartjs'
export default Line.extend({
mounted () {
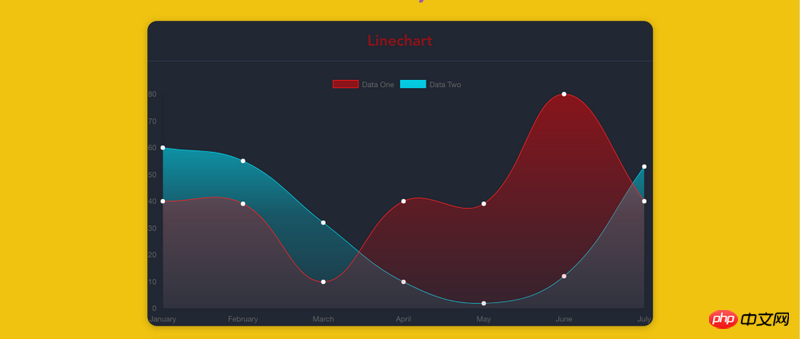
this.renderChart({
labels: ['January', 'February', 'March', 'April', 'May', 'June', 'July'],
datasets: [
{
label: 'Data One',
backgroundColor: '#FC2525',
data: [40, 39, 10, 40, 39, 80, 40]
},{
label: 'Data Two',
backgroundColor: '#05CBE1',
data: [60, 55, 32, 10, 2, 12, 53]
}
]
}, {responsive: true, maintainAspectRatio: false})
}
})In the code, some instance data and optional parameters are passed to the data object of chart.js, and responsive:true is set so that the chart will fill the outer container.
The reason why we can use the renderChart() method is because we inherit BaseChart. This method and some properties are defined in BaseChart.
Run & Test
ok, now delete Hello.vue from App.vue and introduce our chart:
    <template>
      <p id="app">
        <p class="container">
          <p class="Chart__list">
            <p class="Chart">
              <h2>Linechart</h2>
              <line-example></line-example>
            </p>
          </p>
        </p>
      </p>
    </template>

    <script>
    import LineExample from './components/LineChart.js'
    export default {
      name: 'app',
      components: {
        LineExample
      }
    }
    </script>

    <style>
    #app {
      font-family: 'Avenir', Helvetica, Arial, sans-serif;
      -webkit-font-smoothing: antialiased;
      -moz-osx-font-smoothing: grayscale;
      text-align: center;
      color: #2c3e50;
      margin-top: 60px;
    }
    .container {
      max-width: 800px;
      margin:  0 auto;
    }
    </style>
CopyRawRun the dev script in the terminal, You can see the chart.
yarn run dev
Make me more beautiful
Now it’s time to do some beautification work
The above is the detailed content of How to create cool charts using Vue.js and Chart.js. For more information, please follow other related articles on the PHP Chinese website!

Hot AI Tools

Undresser.AI Undress
AI-powered app for creating realistic nude photos

AI Clothes Remover
Online AI tool for removing clothes from photos.

Undress AI Tool
Undress images for free

Clothoff.io
AI clothes remover

Video Face Swap
Swap faces in any video effortlessly with our completely free AI face swap tool!

Hot Article
Hot Tools

Notepad++7.3.1
Easy-to-use and free code editor

SublimeText3 Chinese version
Chinese version, very easy to use

Zend Studio 13.0.1
Powerful PHP integrated development environment

Dreamweaver CS6
Visual web development tools

SublimeText3 Mac version
God-level code editing software (SublimeText3)
Hot Topics


 How to add labels to legend in Google Sheet
Feb 19, 2024 am 11:03 AM
How to add labels to legend in Google Sheet
Feb 19, 2024 am 11:03 AM
This article will demonstrate how to add labels to legends in Google Sheet that focus on a single thing, providing a name or identity. A legend explains a system or group of things, giving you relevant contextual information. How to Add Labels to a Legend in GoogleSheet Sometimes, when working with charts, we want to make them easier to understand. This can be achieved by adding appropriate labels and legends. Next, we’ll show you how to add labels to legends in Google Sheets to make your data clearer. Create the chart Edit the text of the legend label Let's get started. 1] Create a chart To label the legend, first, we have to create a chart: First, enter in the columns or rows of GoogleSheets
 PHP and Vue: a perfect pairing of front-end development tools
Mar 16, 2024 pm 12:09 PM
PHP and Vue: a perfect pairing of front-end development tools
Mar 16, 2024 pm 12:09 PM
PHP and Vue: a perfect pairing of front-end development tools. In today's era of rapid development of the Internet, front-end development has become increasingly important. As users have higher and higher requirements for the experience of websites and applications, front-end developers need to use more efficient and flexible tools to create responsive and interactive interfaces. As two important technologies in the field of front-end development, PHP and Vue.js can be regarded as perfect tools when paired together. This article will explore the combination of PHP and Vue, as well as detailed code examples to help readers better understand and apply these two
 Is Django front-end or back-end? check it out!
Jan 19, 2024 am 08:37 AM
Is Django front-end or back-end? check it out!
Jan 19, 2024 am 08:37 AM
Django is a web application framework written in Python that emphasizes rapid development and clean methods. Although Django is a web framework, to answer the question whether Django is a front-end or a back-end, you need to have a deep understanding of the concepts of front-end and back-end. The front end refers to the interface that users directly interact with, and the back end refers to server-side programs. They interact with data through the HTTP protocol. When the front-end and back-end are separated, the front-end and back-end programs can be developed independently to implement business logic and interactive effects respectively, and data exchange.
 Simple JavaScript Tutorial: How to Get HTTP Status Code
Jan 05, 2024 pm 06:08 PM
Simple JavaScript Tutorial: How to Get HTTP Status Code
Jan 05, 2024 pm 06:08 PM
JavaScript tutorial: How to get HTTP status code, specific code examples are required. Preface: In web development, data interaction with the server is often involved. When communicating with the server, we often need to obtain the returned HTTP status code to determine whether the operation is successful, and perform corresponding processing based on different status codes. This article will teach you how to use JavaScript to obtain HTTP status codes and provide some practical code examples. Using XMLHttpRequest
 How to insert a chart in word
Mar 20, 2024 pm 03:41 PM
How to insert a chart in word
Mar 20, 2024 pm 03:41 PM
Sometimes in order to display the data more intuitively, we need to use charts to display it. But when it comes to charts, many people think that they can only be operated on Excel. In fact, this is not the case. Word can also directly insert charts. How to do it? Just take a look and you'll find out. 1. First we open a word document. 2. Next we find the "Chart" tool button in the "Insert" menu and click it. 3. Click the "Chart" button and select a suitable chart. Here we can select a chart type at will and click "OK". 4. After selecting the chart, the system will automatically open the excel chart, and inside The data has been entered, we just need to change the data. If you have already prepared the form here,
 Exploring Go language front-end technology: a new vision for front-end development
Mar 28, 2024 pm 01:06 PM
Exploring Go language front-end technology: a new vision for front-end development
Mar 28, 2024 pm 01:06 PM
As a fast and efficient programming language, Go language is widely popular in the field of back-end development. However, few people associate Go language with front-end development. In fact, using Go language for front-end development can not only improve efficiency, but also bring new horizons to developers. This article will explore the possibility of using the Go language for front-end development and provide specific code examples to help readers better understand this area. In traditional front-end development, JavaScript, HTML, and CSS are often used to build user interfaces
 Questions frequently asked by front-end interviewers
Mar 19, 2024 pm 02:24 PM
Questions frequently asked by front-end interviewers
Mar 19, 2024 pm 02:24 PM
In front-end development interviews, common questions cover a wide range of topics, including HTML/CSS basics, JavaScript basics, frameworks and libraries, project experience, algorithms and data structures, performance optimization, cross-domain requests, front-end engineering, design patterns, and new technologies and trends. . Interviewer questions are designed to assess the candidate's technical skills, project experience, and understanding of industry trends. Therefore, candidates should be fully prepared in these areas to demonstrate their abilities and expertise.
 Django: A magical framework that can handle both front-end and back-end development!
Jan 19, 2024 am 08:52 AM
Django: A magical framework that can handle both front-end and back-end development!
Jan 19, 2024 am 08:52 AM
Django: A magical framework that can handle both front-end and back-end development! Django is an efficient and scalable web application framework. It is able to support multiple web development models, including MVC and MTV, and can easily develop high-quality web applications. Django not only supports back-end development, but can also quickly build front-end interfaces and achieve flexible view display through template language. Django combines front-end development and back-end development into a seamless integration, so developers don’t have to specialize in learning
