应使用 nginx-module-vts 模块配合 map 指令动态分组,使 Prometheus 直接采集带 method 标签的指标;若未启用 vts,则用 nginxlog-exporter 解析 access log 并提取 $request_method 维度。
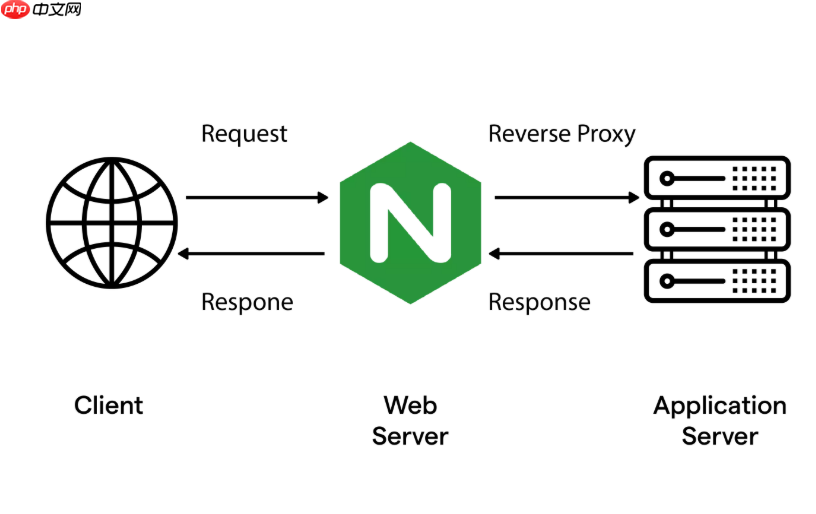
直接统计不同请求方法(GET、POST、PUT、DELETE 等)的分布,关键在于让 Prometheus 能采集到按 $request_method 维度打标的指标,而不是依赖日志后期解析。
在 Nginx 配置中暴露 method 标签的指标
Nginx 原生不带 method 维度的指标,需借助 nginx-module-vts 模块并配合自定义分组或 Lua 增强:
- 为不同请求方法显式划分 vhost_traffic_status_zone,例如:
location /api/ {
# 匹配 POST 请求单独归组
if ($request_method = POST) {
vhost_traffic_status_zone group=api_post;
}
# 其他方法走默认组
vhost_traffic_status_zone group=api_other;
proxy_pass http://backend;
}
- 更推荐方式:用 map 预定义 method 类型变量,在 vts zone 名称中嵌入它(需 nginx-module-vts ≥ 0.1.18 支持动态 zone 名):
map $request_method $method_group {
GET "get";
POST "post";
PUT "put";
DELETE "delete";
default "other";
}
vhost_traffic_status_zone group=api_by_method:$method_group;
这样 Prometheus 抓取 /vts/status/format/prometheus 后,会得到类似:

nginx_vts_http_request_total{group="api_by_method:post"} 1247
nginx_vts_http_request_total{group="api_by_method:get"} 8932
用 nginxlog-exporter 补充细粒度 method 分布
若未启用 vts 或需同时统计静态/动态所有路径的 method,可用 nginxlog-exporter 解析 access log:
- 确保 log_format 包含
$request_method字段(默认 combined 格式已包含) - 配置 exporter 的 metrics 部分,添加 method 维度提取规则:
- name: nginx_http_requests_total
help: Total number of HTTP requests
type: counter
labels:
method: '$request_method'
status: '$status'
path: '$uri'
重启 exporter 后,即可查 PromQL:sum by (method) (rate(nginx_http_requests_total[1h]))
验证与常用查询
上线后建议立即验证数据是否正常上报:
- 访问
http://nginx-host:port/vts/status/format/prometheus,搜索api_by_method或method确认指标存在 - 在 Prometheus Graph 中执行:
sum(rate(nginx_vts_http_request_total{group=~"api.*"}[5m])) by (group)→ 看各 method 组是否持续增长 - 计算占比(如 POST 占比):
rate(nginx_vts_http_request_total{group="api_by_method:post"}[1h]) / sum(rate(nginx_vts_http_request_total{group=~"api_by_method:.*"}[1h]))