
 Technology peripherals
AI
How to create diagrams using ChatGPT! Illustrated loading and plugins are also explained
Technology peripherals
AI
How to create diagrams using ChatGPT! Illustrated loading and plugins are also explained
How to create diagrams using ChatGPT! Illustrated loading and plugins are also explained

An efficient guide to creating charts using AI
Visual materials are essential to effectively conveying information, but creating it takes a lot of time and effort. However, the chart creation process is changing dramatically due to the rise of AI technologies such as ChatGPT and DALL-E 3. This article provides detailed explanations on efficient and attractive diagram creation methods using these cutting-edge tools. It covers everything from ideas to completion, and provides a wealth of information that will be useful for creating diagrams, from specific steps, tips, plugins and APIs that can be used, and how to use the image generation AI "DALL-E 3."
table of contents
- Creating charts using ChatGPT
- Examples of using visual materials and illustrations created with ChatGPT
- The flow and key points of creating charts using ChatGPT
- How to create diagrams with ChatGPT plugin
- Scenarios for using ChatGPT to create charts
- Things to note when creating charts using ChatGPT
- Other AI tools that allow you to create charts
- summary
Creating charts using ChatGPT
ChatGPT is a versatile AI that offers a wide range of functions beyond conversational functions. The following three main functions are particularly effective when creating charts:
- Provide text-based diagram explanations: When explaining diagram concepts to ChatGPT, it suggests text-based outlines and design ideas. For example, if you want to visualize the rise in global average temperatures and glacial melting over the past 50 years, ChatGPT outputs multiple suggestions.

- Creating code for graphic generation: ChatGPT generates code such as matplotlib in Python and D3.js in JavaScript, helping you create simple graphics. Visualization codes for temperature changes using data on the global average temperature from 1970 to 2020 can be generated and code explanations can be provided.

- Data visualization suggestions: By providing datasets and information types to ChatGPT, you can suggest the best chart type. If you want to visually analyze the relationship between economic growth and population growth from data on population growth around the world, you can get suggestions for choosing the right visualization method.

Examples of using visual materials and illustrations created with ChatGPT
Charts created with ChatGPT can be used for a variety of purposes.
Concept Description: Create diagrams that explain the key features and benefits of the new mobile app.

Support for educational materials: Helps in creating process diagrams that explain the photosynthesis process.
Business Presentation: Provides advice on creating a flow chart for the new product development process.


The flow and key points of creating charts using ChatGPT
- Organize information: Clearly organize what you want to convey in charts.
- Questioning ChatGPT: Based on the organized information, ask ChatGPT to propose diagram and chart outlines.
- Selecting a Plugin Tool: Select a tool that embodies ChatGPT's proposal.
- Draft creation: Create a draft using the tool based on information from ChatGPT.
- Feedback and Improvements: Share your drafts and get feedback and improve.
- Complete the final drawing: Reflect the feedback and complete the final drawing.
Key points: Clarification of purpose, pursuit of simplicity, visual consistency, use of feedback, and flexible attitudes are important.
How to create diagrams with ChatGPT plugin
Although ChatGPT itself cannot draw diagrams and charts, it can be used to link various plugins and APIs to help you create diagrams.
ChatGPT Plugins (Beta): Connects ChatGPT with third-party development tools and services to extend functionality.
Diagrams API: Tools such as Mermaid, Graphviz generate diagrams based on description languages.
Mermaid: Easily create text-based flowcharts and other files.
Graphviz: Automatically generate graphical diagrams in the DOT language.
Data Visualization Libraries: Take advantage of libraries such as D3.js, matplotlib, and Highcharts.


Scenarios for using ChatGPT to create charts
Generate a flow chart: Create a flow chart based on the ChatGPT outline using Lucidchart etc.
Design your infographic: Create infographics based on ChatGPT suggestions in Canva or Adobe Express.
Creating Data Visualizations: Create graphs and charts based on ChatGPT suggestions, such as matplotlib.


Things to note when creating charts using ChatGPT
- Copyright and Permission: ChatGPT output may be similar to existing copyrighted works.
- Information Accuracy: ChatGPT's proposals are not always accurate.
- Design Quality: ChatGPT is not a replacement for professional designers.
- Consideration for accessibility: A design that is designed with accessibility is required.
- Ethical considerations: The content should be ethically free.
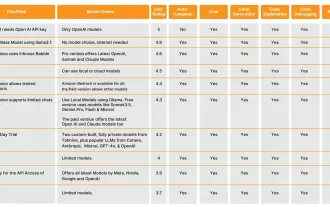
Other AI tools that allow you to create charts
AI image generation tools: DALL-E, Stable Diffusion, etc.
Automatic layout tools: FigJam AI, Microsoft Designer, etc.


summary
AI tools such as ChatGPT make chart creation more efficient, but human creativity and judgment are essential. Combining the strengths of AI tools with human abilities allows for more effective visual communication. Always keep in mind that AI is an auxiliary tool and that ultimately responsibly lies with the user.
The above is the detailed content of How to create diagrams using ChatGPT! Illustrated loading and plugins are also explained. For more information, please follow other related articles on the PHP Chinese website!

Hot AI Tools

Undresser.AI Undress
AI-powered app for creating realistic nude photos

AI Clothes Remover
Online AI tool for removing clothes from photos.

Undress AI Tool
Undress images for free

Clothoff.io
AI clothes remover

Video Face Swap
Swap faces in any video effortlessly with our completely free AI face swap tool!

Hot Article
Hot Tools

Notepad++7.3.1
Easy-to-use and free code editor

SublimeText3 Chinese version
Chinese version, very easy to use

Zend Studio 13.0.1
Powerful PHP integrated development environment

Dreamweaver CS6
Visual web development tools

SublimeText3 Mac version
God-level code editing software (SublimeText3)
Hot Topics
 1667
1667
 14
1426
52
1328
25
1273
29
1255
24
14
1426
52
1328
25
1273
29
1255
24

 10 Generative AI Coding Extensions in VS Code You Must Explore
Apr 13, 2025 am 01:14 AM
10 Generative AI Coding Extensions in VS Code You Must Explore
Apr 13, 2025 am 01:14 AM
Hey there, Coding ninja! What coding-related tasks do you have planned for the day? Before you dive further into this blog, I want you to think about all your coding-related woes—better list those down. Done? – Let’
 GPT-4o vs OpenAI o1: Is the New OpenAI Model Worth the Hype?
Apr 13, 2025 am 10:18 AM
GPT-4o vs OpenAI o1: Is the New OpenAI Model Worth the Hype?
Apr 13, 2025 am 10:18 AM
Introduction OpenAI has released its new model based on the much-anticipated “strawberry” architecture. This innovative model, known as o1, enhances reasoning capabilities, allowing it to think through problems mor
 Pixtral-12B: Mistral AI's First Multimodal Model - Analytics Vidhya
Apr 13, 2025 am 11:20 AM
Pixtral-12B: Mistral AI's First Multimodal Model - Analytics Vidhya
Apr 13, 2025 am 11:20 AM
Introduction Mistral has released its very first multimodal model, namely the Pixtral-12B-2409. This model is built upon Mistral’s 12 Billion parameter, Nemo 12B. What sets this model apart? It can now take both images and tex
 How to Add a Column in SQL? - Analytics Vidhya
Apr 17, 2025 am 11:43 AM
How to Add a Column in SQL? - Analytics Vidhya
Apr 17, 2025 am 11:43 AM
SQL's ALTER TABLE Statement: Dynamically Adding Columns to Your Database In data management, SQL's adaptability is crucial. Need to adjust your database structure on the fly? The ALTER TABLE statement is your solution. This guide details adding colu
 How to Build MultiModal AI Agents Using Agno Framework?
Apr 23, 2025 am 11:30 AM
How to Build MultiModal AI Agents Using Agno Framework?
Apr 23, 2025 am 11:30 AM
While working on Agentic AI, developers often find themselves navigating the trade-offs between speed, flexibility, and resource efficiency. I have been exploring the Agentic AI framework and came across Agno (earlier it was Phi-
 Beyond The Llama Drama: 4 New Benchmarks For Large Language Models
Apr 14, 2025 am 11:09 AM
Beyond The Llama Drama: 4 New Benchmarks For Large Language Models
Apr 14, 2025 am 11:09 AM
Troubled Benchmarks: A Llama Case Study In early April 2025, Meta unveiled its Llama 4 suite of models, boasting impressive performance metrics that positioned them favorably against competitors like GPT-4o and Claude 3.5 Sonnet. Central to the launc
 OpenAI Shifts Focus With GPT-4.1, Prioritizes Coding And Cost Efficiency
Apr 16, 2025 am 11:37 AM
OpenAI Shifts Focus With GPT-4.1, Prioritizes Coding And Cost Efficiency
Apr 16, 2025 am 11:37 AM
The release includes three distinct models, GPT-4.1, GPT-4.1 mini and GPT-4.1 nano, signaling a move toward task-specific optimizations within the large language model landscape. These models are not immediately replacing user-facing interfaces like
 How ADHD Games, Health Tools & AI Chatbots Are Transforming Global Health
Apr 14, 2025 am 11:27 AM
How ADHD Games, Health Tools & AI Chatbots Are Transforming Global Health
Apr 14, 2025 am 11:27 AM
Can a video game ease anxiety, build focus, or support a child with ADHD? As healthcare challenges surge globally — especially among youth — innovators are turning to an unlikely tool: video games. Now one of the world’s largest entertainment indus
