

Here are 2 Ways to Create Heatmap in Power BI - Analytics Vidhya

Data Visualization with Power BI Heatmaps: A Comprehensive Guide
Ever felt overwhelmed by tables of numbers? Transform raw data—sales figures, demographics, financial data—into clear insights using data visualization, specifically heatmaps. This guide shows you how to create effective heatmaps in Power BI, from basic techniques to advanced custom visuals.

Key Concepts:
- Heatmaps visually represent data density and trends, converting raw data into actionable knowledge.
- Learn to build heatmaps in Power BI using built-in features (conditional formatting) and custom visuals.
- Color gradients highlight data values, making patterns and trends immediately apparent.
- Power BI's conditional formatting simplifies heatmap creation by color-coding cells based on values.
- Premium Power BI users can access advanced geographical heatmaps via custom visuals from Microsoft AppSource.
- Effective heatmaps require careful design: choose appropriate colors and data ranges (binning).
Table of Contents:
- Understanding Heatmaps
- Two Methods for Creating Power BI Heatmaps
- Conditional Formatting: A Step-by-Step Guide
- Step 1: Launching Power BI Desktop and Importing Data
- Step 2: Utilizing the Matrix Visual
- Step 3: Applying Conditional Formatting
- Custom Visuals for Enhanced Heatmaps (Power BI Premium)
- Step 1: Installing a Custom Visual
- Step 2: Implementing the Heatmap
- Frequently Asked Questions
Understanding Heatmaps:

Heatmaps use color to represent data values, showing data distribution and intensity. Color gradients illustrate the concentration or magnitude of values (pixel intensity, frequencies, statistical measures). This allows for rapid identification of patterns, trends, and outliers, useful across various fields (biology, finance, geology, image processing).
Two Methods for Creating Power BI Heatmaps:
Power BI offers flexible heatmap creation:
- Conditional Formatting: A simple method for quickly creating heatmaps within tables or matrices by color-coding cells based on their values.
- Custom Visuals: (Power BI Premium) Utilize custom map visuals from AppSource for more sophisticated heatmaps, including geographical visualizations.
Tips for Effective Heatmaps:
- Color Choice: Select distinct, easily distinguishable colors to represent data ranges.
- Data Binning: For measures with wide ranges, group data into bins for improved clarity.
- Interactivity: Enable tooltips and interactive elements for detailed data exploration.
Conditional Formatting: A Step-by-Step Guide:
Step 1: Power BI Desktop and Data Import

- Open Power BI Desktop. Import your dataset ("Get Data," select your source). You can also use the "Import Data" option.
Data Preparation and Import

- Organize your data. (Example: Product sales data shown below). Click "Load" or "Transform" (for data cleaning) then "Load."
Example CSV: Product_Sales_DataDownload
Data Table Example:

Step 2: Inserting a Matrix Visual

From the "Visualizations" pane, select the "Matrix" visual. Drag fields to "Rows," "Columns," and "Values" (e.g., sum of sales).

Data Customization
Remove unnecessary date hierarchies (Year, Quarter, Date). Choose the appropriate aggregator function ("Sum," "Average," etc.).
Step 3: Applying Conditional Formatting

In the "Format" pane, expand "Cell Elements." Enable "Background color," click "fx," and define your color scheme based on your data values. Similarly, adjust "Font color." (Note: Turning off row and column subtotals improves visual clarity.)
Background and Font Color Customization


Custom Visuals for Enhanced Heatmaps (Power BI Premium):

Step 1: Installing a Custom Visual
In the "Visualizations" pane, click the three dots, then "Get more visuals." Search for and add a heatmap visual.

Step 2: Implementing the Heatmap


Conclusion:
Power BI heatmaps effectively visualize data, revealing patterns and trends. Use conditional formatting for quick visualizations or custom visuals for advanced features. Careful design choices enhance readability and impact.
Frequently Asked Questions:
Q1: What is a Power BI Heatmap? A data visualization using color to represent data values, revealing patterns and outliers.
Q2: How to improve Heatmap readability? Use clear color scales, add data labels/tooltips, use appropriate aggregation levels, apply filters, and include a descriptive title and axis labels.
Q3: Common Heatmap uses in Power BI? Analyzing sales, customer behavior, performance metrics, website traffic, and financial data.
The above is the detailed content of Here are 2 Ways to Create Heatmap in Power BI - Analytics Vidhya. For more information, please follow other related articles on the PHP Chinese website!

Hot AI Tools

Undresser.AI Undress
AI-powered app for creating realistic nude photos

AI Clothes Remover
Online AI tool for removing clothes from photos.

Undress AI Tool
Undress images for free

Clothoff.io
AI clothes remover

Video Face Swap
Swap faces in any video effortlessly with our completely free AI face swap tool!

Hot Article
Hot Tools

Notepad++7.3.1
Easy-to-use and free code editor

SublimeText3 Chinese version
Chinese version, very easy to use

Zend Studio 13.0.1
Powerful PHP integrated development environment

Dreamweaver CS6
Visual web development tools

SublimeText3 Mac version
God-level code editing software (SublimeText3)
Hot Topics


 Best AI Art Generators (Free & Paid) for Creative Projects
Apr 02, 2025 pm 06:10 PM
Best AI Art Generators (Free & Paid) for Creative Projects
Apr 02, 2025 pm 06:10 PM
The article reviews top AI art generators, discussing their features, suitability for creative projects, and value. It highlights Midjourney as the best value for professionals and recommends DALL-E 2 for high-quality, customizable art.
 Getting Started With Meta Llama 3.2 - Analytics Vidhya
Apr 11, 2025 pm 12:04 PM
Getting Started With Meta Llama 3.2 - Analytics Vidhya
Apr 11, 2025 pm 12:04 PM
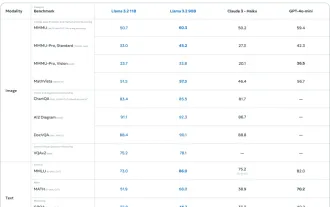
Meta's Llama 3.2: A Leap Forward in Multimodal and Mobile AI Meta recently unveiled Llama 3.2, a significant advancement in AI featuring powerful vision capabilities and lightweight text models optimized for mobile devices. Building on the success o
 Best AI Chatbots Compared (ChatGPT, Gemini, Claude & More)
Apr 02, 2025 pm 06:09 PM
Best AI Chatbots Compared (ChatGPT, Gemini, Claude & More)
Apr 02, 2025 pm 06:09 PM
The article compares top AI chatbots like ChatGPT, Gemini, and Claude, focusing on their unique features, customization options, and performance in natural language processing and reliability.
 Top AI Writing Assistants to Boost Your Content Creation
Apr 02, 2025 pm 06:11 PM
Top AI Writing Assistants to Boost Your Content Creation
Apr 02, 2025 pm 06:11 PM
The article discusses top AI writing assistants like Grammarly, Jasper, Copy.ai, Writesonic, and Rytr, focusing on their unique features for content creation. It argues that Jasper excels in SEO optimization, while AI tools help maintain tone consist
 AV Bytes: Meta's Llama 3.2, Google's Gemini 1.5, and More
Apr 11, 2025 pm 12:01 PM
AV Bytes: Meta's Llama 3.2, Google's Gemini 1.5, and More
Apr 11, 2025 pm 12:01 PM
This week's AI landscape: A whirlwind of advancements, ethical considerations, and regulatory debates. Major players like OpenAI, Google, Meta, and Microsoft have unleashed a torrent of updates, from groundbreaking new models to crucial shifts in le
 Top 7 Agentic RAG System to Build AI Agents
Mar 31, 2025 pm 04:25 PM
Top 7 Agentic RAG System to Build AI Agents
Mar 31, 2025 pm 04:25 PM
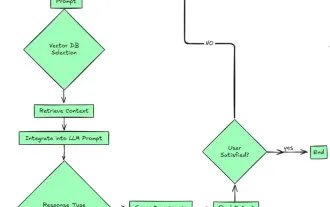
2024 witnessed a shift from simply using LLMs for content generation to understanding their inner workings. This exploration led to the discovery of AI Agents – autonomous systems handling tasks and decisions with minimal human intervention. Buildin
 Selling AI Strategy To Employees: Shopify CEO's Manifesto
Apr 10, 2025 am 11:19 AM
Selling AI Strategy To Employees: Shopify CEO's Manifesto
Apr 10, 2025 am 11:19 AM
Shopify CEO Tobi Lütke's recent memo boldly declares AI proficiency a fundamental expectation for every employee, marking a significant cultural shift within the company. This isn't a fleeting trend; it's a new operational paradigm integrated into p
 Choosing the Best AI Voice Generator: Top Options Reviewed
Apr 02, 2025 pm 06:12 PM
Choosing the Best AI Voice Generator: Top Options Reviewed
Apr 02, 2025 pm 06:12 PM
The article reviews top AI voice generators like Google Cloud, Amazon Polly, Microsoft Azure, IBM Watson, and Descript, focusing on their features, voice quality, and suitability for different needs.
