

Top 20 Python Libraries for Data Analysis for 2025

In today's data-driven world, efficient data analysis is paramount for informed decision-making. Python, with its user-friendly syntax and extensive libraries, has become the go-to language for data scientists and analysts. This article highlights ten essential Python libraries for data analysis, catering to both novice and experienced users.
Table of Contents
-
- NumPy
-
- Pandas
-
- Matplotlib
-
- Seaborn
-
- SciPy
-
- Scikit-learn
-
- Statsmodels
-
- Plotly
-
- PySpark
-
- Altair
- Selecting the Right Library
- Python's Data Analysis Advantages
- Conclusion
-
NumPy: The Foundation
NumPy forms the bedrock of Python's numerical computing capabilities. It excels at handling large, multi-dimensional arrays and matrices, providing a comprehensive suite of mathematical functions for efficient array manipulation.
Strengths:
- Optimized for large datasets.
- Robust mathematical functions (linear algebra, Fourier transforms).
- Seamless integration with other libraries.
Limitations:
- Lacks advanced data manipulation features.
- Requires Pandas for labeled data.
import numpy as np

data = np.array([1, 2, 3, 4, 5])
print("Array:", data)
print("Mean:", np.mean(data))
print("Standard Deviation:", np.std(data))Output

-
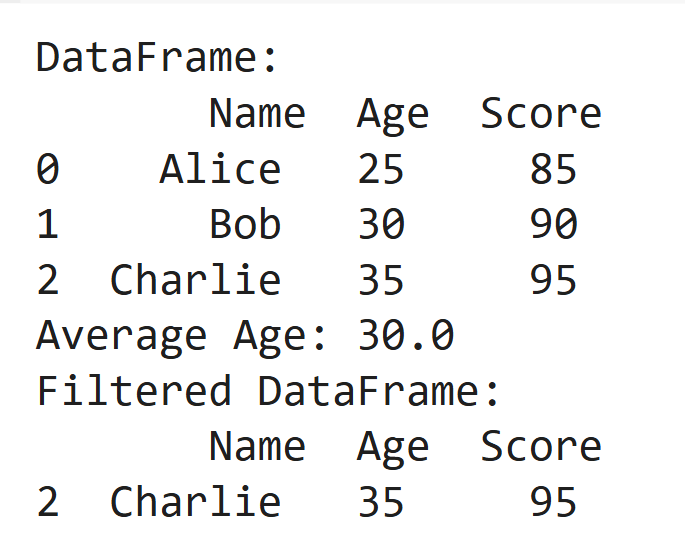
Pandas: Data Wrangling Made Easy
Pandas simplifies data manipulation with its DataFrame structure, ideal for working with tabular data. Cleaning, transforming, and analyzing structured datasets becomes significantly easier with Pandas.
Strengths:
- Streamlines data preprocessing.
- Powerful functions for merging, filtering, and grouping.
- Excellent NumPy integration.
Limitations:
- Performance can degrade with extremely large datasets.
- High memory consumption for massive datasets.
import pandas as pd

data = pd.DataFrame({'Name': ['Alice', 'Bob', 'Charlie'], 'Age': [25, 30, 35], 'Score': [85, 90, 95]})
print("DataFrame:\n", data)
print("Average Age:", data['Age'].mean())
print("Filtered DataFrame:\n", data[data['Score'] > 90])Output
-
Matplotlib: Static and Interactive Visualizations
Matplotlib is a versatile plotting library, enabling the creation of a wide range of static, interactive, and even animated visualizations.
Strengths:
- Highly customizable plots.
- Foundation for other plotting libraries.
- Supports various plot types (line, scatter, bar, etc.).
Limitations:
- Can be complex for advanced visualizations.
- Aesthetics may be less polished than newer libraries.
import matplotlib.pyplot as plt

x = [1, 2, 3, 4, 5]
y = [2, 4, 6, 8, 10]
plt.plot(x, y, label="Line Plot")
plt.xlabel('X-axis')
plt.ylabel('Y-axis')
plt.title('Matplotlib Example')
plt.legend()
plt.show()Output

-
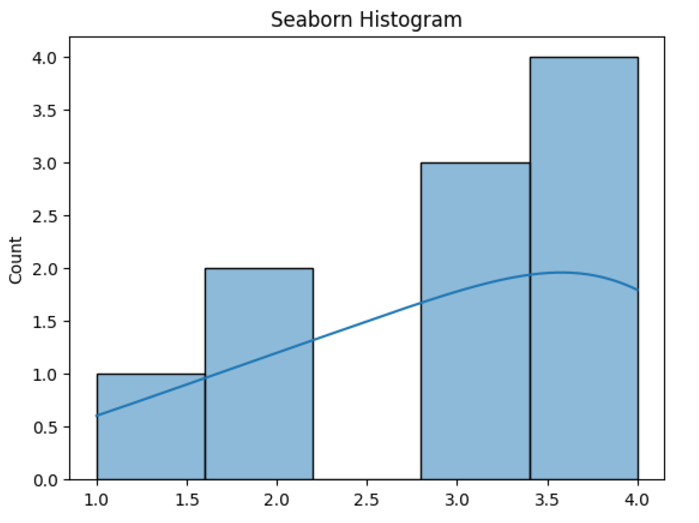
Seaborn: Statistical Visualizations with Style
Seaborn builds upon Matplotlib, simplifying the creation of statistically informative and visually appealing plots.
Strengths:
- Elegant and informative visualizations.
- Built-in themes and color palettes.
- Easy creation of complex statistical plots (heatmaps, pair plots).
Limitations:
- Relies on Matplotlib.
- Customization options are less extensive than Matplotlib.
import seaborn as sns
import matplotlib.pyplot as plt

data = [1, 2, 2, 3, 3, 3, 4, 4, 4, 4]
sns.histplot(data, kde=True)
plt.title('Seaborn Histogram')
plt.show()Output
-
SciPy: Scientific Computing Tools
SciPy extends NumPy, offering advanced tools for scientific computing, including optimization, integration, and signal processing.
Strengths:
- Comprehensive library for scientific tasks.
- Well-documented and extensively used.
- Integrates well with NumPy and Pandas.
Limitations:
- Requires understanding of scientific computing concepts.
- Not ideal for high-level data manipulation.
from scipy.stats import ttest_ind

group1 = [1, 2, 3, 4, 5]
group2 = [2, 3, 4, 5, 6]
t_stat, p_value = ttest_ind(group1, group2)
print("T-Statistic:", t_stat)
print("P-Value:", p_value)Output

-
Scikit-learn: Machine Learning in Python
Scikit-learn is a powerful machine learning library, providing tools for classification, regression, clustering, and dimensionality reduction.
Strengths:
- User-friendly API.
- Wide range of machine learning models.
- Integrates well with Pandas and NumPy.
Limitations:
- Limited deep learning support.
- Not optimized for large-scale distributed training.
from sklearn.linear_model import LinearRegression

X = [[1], [2], [3], [4]]
y = [2, 4, 6, 8]
model = LinearRegression()
model.fit(X, y)
print("Prediction for X=5:", model.predict([[5]])[0])Output

-
Statsmodels: Statistical Modeling and Testing
Statsmodels focuses on statistical modeling and hypothesis testing, particularly useful for econometrics and statistical research.
Strengths:
- Detailed statistical test results.
- Strong emphasis on hypothesis testing.
- Well-suited for econometric analysis.
Limitations:
- Steeper learning curve.
- Can be slower than Scikit-learn for predictive modeling.
import statsmodels.api as sm

X = [1, 2, 3, 4]
y = [2, 4, 6, 8]
X = sm.add_constant(X)
model = sm.OLS(y, X).fit()
print(model.summary())
Output

-
Plotly: Interactive Web-Based Visualizations
Plotly creates interactive and web-ready visualizations, perfect for dashboards and web applications.
Strengths:
- Highly interactive plots.
- Easy web application integration.
- Supports 3D and advanced chart types.
Limitations:
- Higher browser resource usage for large datasets.
- May require additional configuration for deployment.
import plotly.express as px

data = px.data.iris()
fig = px.scatter(data, x="sepal_width", y="sepal_length", color="species", title="Iris Dataset Scatter Plot")
fig.show()
Output

-
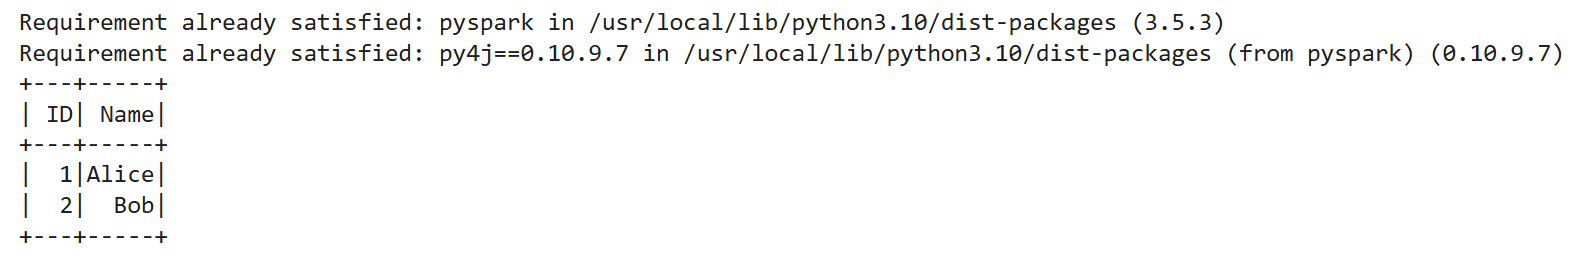
PySpark: Big Data Processing with Spark
PySpark provides a Python interface to Apache Spark, enabling distributed computing for large-scale data processing.
Strengths:
- Efficient big data handling.
- Integrates with Hadoop and other big data tools.
- Includes MLlib for machine learning.
Limitations:
- Requires a Spark environment.
- Steeper learning curve.
!pip install pyspark
from pyspark.sql import SparkSession

spark = SparkSession.builder.appName("PySpark Example").getOrCreate()
data = spark.createDataFrame([(1, "Alice"), (2, "Bob")], ["ID", "Name"])
data.show()Output
-
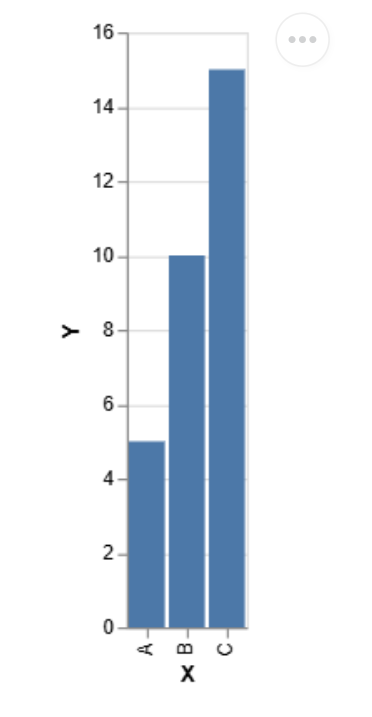
Altair: Declarative Statistical Visualizations
Altair is a declarative visualization library based on Vega and Vega-Lite, offering a concise syntax for creating sophisticated plots.
Strengths:
- Simple syntax for complex visualizations.
- Integrates well with Pandas.
Limitations:
- Less interactive than Plotly.
- Not ideal for extremely large datasets.
import altair as alt
import pandas as pd

data = pd.DataFrame({'X': ['A', 'B', 'C'], 'Y': [5, 10, 15]})
chart = alt.Chart(data).mark_bar().encode(x='X', y='Y')
chart.display()Output
Selecting the Right Library
Choosing the appropriate library depends on several factors: the nature of your task (data cleaning, visualization, modeling), dataset size, analysis objectives, and your experience level. Consider the strengths and limitations of each library before making your selection.
Python's Data Analysis Advantages
Python's popularity in data analysis stems from its ease of use, extensive libraries, strong community support, and seamless integration with big data tools.
Conclusion
Python's rich ecosystem of libraries empowers data analysts to tackle diverse challenges, from simple data exploration to complex machine learning tasks. Selecting the right tools for the job is crucial, and this overview provides a solid foundation for choosing the best Python libraries for your data analysis needs.
The above is the detailed content of Top 20 Python Libraries for Data Analysis for 2025. For more information, please follow other related articles on the PHP Chinese website!

Hot AI Tools

Undresser.AI Undress
AI-powered app for creating realistic nude photos

AI Clothes Remover
Online AI tool for removing clothes from photos.

Undress AI Tool
Undress images for free

Clothoff.io
AI clothes remover

Video Face Swap
Swap faces in any video effortlessly with our completely free AI face swap tool!

Hot Article
Hot Tools

Notepad++7.3.1
Easy-to-use and free code editor

SublimeText3 Chinese version
Chinese version, very easy to use

Zend Studio 13.0.1
Powerful PHP integrated development environment

Dreamweaver CS6
Visual web development tools

SublimeText3 Mac version
God-level code editing software (SublimeText3)
Hot Topics
 1668
1668
 14
1426
52
1328
25
1273
29
1255
24
14
1426
52
1328
25
1273
29
1255
24

 10 Generative AI Coding Extensions in VS Code You Must Explore
Apr 13, 2025 am 01:14 AM
10 Generative AI Coding Extensions in VS Code You Must Explore
Apr 13, 2025 am 01:14 AM
Hey there, Coding ninja! What coding-related tasks do you have planned for the day? Before you dive further into this blog, I want you to think about all your coding-related woes—better list those down. Done? – Let’
 GPT-4o vs OpenAI o1: Is the New OpenAI Model Worth the Hype?
Apr 13, 2025 am 10:18 AM
GPT-4o vs OpenAI o1: Is the New OpenAI Model Worth the Hype?
Apr 13, 2025 am 10:18 AM
Introduction OpenAI has released its new model based on the much-anticipated “strawberry” architecture. This innovative model, known as o1, enhances reasoning capabilities, allowing it to think through problems mor
 Pixtral-12B: Mistral AI's First Multimodal Model - Analytics Vidhya
Apr 13, 2025 am 11:20 AM
Pixtral-12B: Mistral AI's First Multimodal Model - Analytics Vidhya
Apr 13, 2025 am 11:20 AM
Introduction Mistral has released its very first multimodal model, namely the Pixtral-12B-2409. This model is built upon Mistral’s 12 Billion parameter, Nemo 12B. What sets this model apart? It can now take both images and tex
 How to Add a Column in SQL? - Analytics Vidhya
Apr 17, 2025 am 11:43 AM
How to Add a Column in SQL? - Analytics Vidhya
Apr 17, 2025 am 11:43 AM
SQL's ALTER TABLE Statement: Dynamically Adding Columns to Your Database In data management, SQL's adaptability is crucial. Need to adjust your database structure on the fly? The ALTER TABLE statement is your solution. This guide details adding colu
 How to Build MultiModal AI Agents Using Agno Framework?
Apr 23, 2025 am 11:30 AM
How to Build MultiModal AI Agents Using Agno Framework?
Apr 23, 2025 am 11:30 AM
While working on Agentic AI, developers often find themselves navigating the trade-offs between speed, flexibility, and resource efficiency. I have been exploring the Agentic AI framework and came across Agno (earlier it was Phi-
 Beyond The Llama Drama: 4 New Benchmarks For Large Language Models
Apr 14, 2025 am 11:09 AM
Beyond The Llama Drama: 4 New Benchmarks For Large Language Models
Apr 14, 2025 am 11:09 AM
Troubled Benchmarks: A Llama Case Study In early April 2025, Meta unveiled its Llama 4 suite of models, boasting impressive performance metrics that positioned them favorably against competitors like GPT-4o and Claude 3.5 Sonnet. Central to the launc
 OpenAI Shifts Focus With GPT-4.1, Prioritizes Coding And Cost Efficiency
Apr 16, 2025 am 11:37 AM
OpenAI Shifts Focus With GPT-4.1, Prioritizes Coding And Cost Efficiency
Apr 16, 2025 am 11:37 AM
The release includes three distinct models, GPT-4.1, GPT-4.1 mini and GPT-4.1 nano, signaling a move toward task-specific optimizations within the large language model landscape. These models are not immediately replacing user-facing interfaces like
 How ADHD Games, Health Tools & AI Chatbots Are Transforming Global Health
Apr 14, 2025 am 11:27 AM
How ADHD Games, Health Tools & AI Chatbots Are Transforming Global Health
Apr 14, 2025 am 11:27 AM
Can a video game ease anxiety, build focus, or support a child with ADHD? As healthcare challenges surge globally — especially among youth — innovators are turning to an unlikely tool: video games. Now one of the world’s largest entertainment indus
