

20 Examples of Interactive Power BI Dashboards

Data dashboards are essential for modern businesses, offering a concise overview of key performance indicators (KPIs). This article showcases 20 diverse Power BI dashboard examples, demonstrating how data visualization translates raw data into actionable intelligence. These dashboards, spanning sales, marketing, HR, and more, provide inspiration for your own data visualization projects.
Table of Contents
- The Importance of Dashboards
- Building Effective Dashboards: Key Components
- Inspiring Power BI Dashboard Examples
- Sales Performance Dashboard
- Inventory Management Dashboard
- Social Media Performance Dashboard
- Healthcare Operations Dashboard
- Retail Sales Dashboard
- Financial Performance Dashboard
- SEO Analytics Dashboard
- Executive Summary Dashboard
- Brand Sentiment Dashboard
- E-commerce Metrics Dashboard
- Logistics & Shipping Dashboard
- Human Resources Analytics Dashboard
- Hotel Performance Dashboard
- Customer Experience Dashboard
- Mobile App Usage Dashboard
- Marketing Campaign Dashboard
- Project Portfolio Dashboard
- Budget Tracking Dashboard
- Stock Market Tracker
- Sports Analytics Dashboard
- Conclusion: Key Takeaways
- Frequently Asked Questions
The Importance of Dashboards
Interactive dashboards present data in a clear, user-friendly format. By integrating data from various sources (web traffic, sales, social media, etc.), dashboards help you:
- Identify Trends: Recognize patterns and shifts in data.
- Make Data-Driven Decisions: Base choices on insightful analysis.
- Monitor Progress: Track performance against targets.
Dashboards are adaptable and can be customized for specific departments or roles. For instance, a sales dashboard might prioritize revenue and sales pipeline, while an HR dashboard focuses on employee turnover and satisfaction. Effective dashboards emphasize simplicity and clarity, prioritizing relevant metrics and using intuitive visualizations.
Building Effective Dashboards: Key Components
Three core elements define a successful dashboard: Data, Design, and Interactivity.
- Data: The foundation. Raw data is processed, analyzed, and transformed into a usable format for decision-making.
- Design: Creates an intuitive and visually appealing layout. Clear charts, graphs, and a consistent color scheme enhance readability and user experience.
- Interactivity: Unlocks deeper insights. Filters and slicers allow users to explore data, revealing trends and correlations not apparent in static reports.
Inspiring Power BI Dashboard Examples
Below are examples demonstrating exceptional Power BI dashboard design and functionality.
Sales Performance Dashboard
- Tracks key metrics: sales, orders, quantity sold.
- Uses interactive filters and visualizations (bar charts, column charts, heatmaps, line charts, pie charts) to analyze trends, product performance, and sales distribution.
- Provides a clear performance overview, identifying top products, peak sales times, and location trends.

(Link to the Dashboard)
Inventory Management Dashboard
- Monitors inventory metrics: most/least viewed products, stock levels (in stock, low stock, out of stock), sales, and days of supply.
- Includes interactive filters (category, quarter) and "What If" scenario features to simulate changes in fulfillment cycles and markdown variance.
- Optimizes stock levels, predicts restocking needs, and prevents stockouts.

(Link to the Dashboard)
(The remaining 18 dashboard examples would follow a similar structure, replacing the descriptions and images with those for the other dashboards listed in the original text.)
Conclusion: Key Takeaways
Power BI and similar BI tools are crucial for data analysis and decision-making. Dashboards provide real-time insights across various sectors, enabling data-driven decisions and performance optimization.
Frequently Asked Questions
- Q1. What's the most important dashboard component? A. Data—it forms the basis for all insights.
- Q2. Why is design crucial? A. Good design improves user experience, ensuring clarity and efficient navigation.
- Q3. What's the role of interactivity? A. Interactivity enables deeper data exploration through filters and slicers.
- Q4. How does data processing affect dashboards? A. Proper processing transforms raw data into meaningful, accurate insights.
- Q5. What are Power BI dashboards? A. Interactive visualizations consolidating key data and metrics for data-driven decisions.
The above is the detailed content of 20 Examples of Interactive Power BI Dashboards. For more information, please follow other related articles on the PHP Chinese website!

Hot AI Tools

Undresser.AI Undress
AI-powered app for creating realistic nude photos

AI Clothes Remover
Online AI tool for removing clothes from photos.

Undress AI Tool
Undress images for free

Clothoff.io
AI clothes remover

Video Face Swap
Swap faces in any video effortlessly with our completely free AI face swap tool!

Hot Article
Hot Tools

Notepad++7.3.1
Easy-to-use and free code editor

SublimeText3 Chinese version
Chinese version, very easy to use

Zend Studio 13.0.1
Powerful PHP integrated development environment

Dreamweaver CS6
Visual web development tools

SublimeText3 Mac version
God-level code editing software (SublimeText3)
Hot Topics


 Best AI Art Generators (Free & Paid) for Creative Projects
Apr 02, 2025 pm 06:10 PM
Best AI Art Generators (Free & Paid) for Creative Projects
Apr 02, 2025 pm 06:10 PM
The article reviews top AI art generators, discussing their features, suitability for creative projects, and value. It highlights Midjourney as the best value for professionals and recommends DALL-E 2 for high-quality, customizable art.
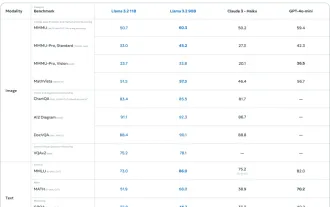
 Getting Started With Meta Llama 3.2 - Analytics Vidhya
Apr 11, 2025 pm 12:04 PM
Getting Started With Meta Llama 3.2 - Analytics Vidhya
Apr 11, 2025 pm 12:04 PM
Meta's Llama 3.2: A Leap Forward in Multimodal and Mobile AI Meta recently unveiled Llama 3.2, a significant advancement in AI featuring powerful vision capabilities and lightweight text models optimized for mobile devices. Building on the success o
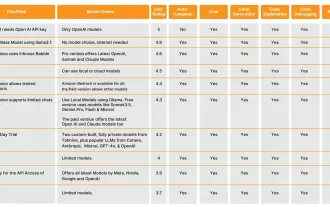
 Best AI Chatbots Compared (ChatGPT, Gemini, Claude & More)
Apr 02, 2025 pm 06:09 PM
Best AI Chatbots Compared (ChatGPT, Gemini, Claude & More)
Apr 02, 2025 pm 06:09 PM
The article compares top AI chatbots like ChatGPT, Gemini, and Claude, focusing on their unique features, customization options, and performance in natural language processing and reliability.
 Top AI Writing Assistants to Boost Your Content Creation
Apr 02, 2025 pm 06:11 PM
Top AI Writing Assistants to Boost Your Content Creation
Apr 02, 2025 pm 06:11 PM
The article discusses top AI writing assistants like Grammarly, Jasper, Copy.ai, Writesonic, and Rytr, focusing on their unique features for content creation. It argues that Jasper excels in SEO optimization, while AI tools help maintain tone consist
 Selling AI Strategy To Employees: Shopify CEO's Manifesto
Apr 10, 2025 am 11:19 AM
Selling AI Strategy To Employees: Shopify CEO's Manifesto
Apr 10, 2025 am 11:19 AM
Shopify CEO Tobi Lütke's recent memo boldly declares AI proficiency a fundamental expectation for every employee, marking a significant cultural shift within the company. This isn't a fleeting trend; it's a new operational paradigm integrated into p
 10 Generative AI Coding Extensions in VS Code You Must Explore
Apr 13, 2025 am 01:14 AM
10 Generative AI Coding Extensions in VS Code You Must Explore
Apr 13, 2025 am 01:14 AM
Hey there, Coding ninja! What coding-related tasks do you have planned for the day? Before you dive further into this blog, I want you to think about all your coding-related woes—better list those down. Done? – Let’
 AV Bytes: Meta's Llama 3.2, Google's Gemini 1.5, and More
Apr 11, 2025 pm 12:01 PM
AV Bytes: Meta's Llama 3.2, Google's Gemini 1.5, and More
Apr 11, 2025 pm 12:01 PM
This week's AI landscape: A whirlwind of advancements, ethical considerations, and regulatory debates. Major players like OpenAI, Google, Meta, and Microsoft have unleashed a torrent of updates, from groundbreaking new models to crucial shifts in le
 Choosing the Best AI Voice Generator: Top Options Reviewed
Apr 02, 2025 pm 06:12 PM
Choosing the Best AI Voice Generator: Top Options Reviewed
Apr 02, 2025 pm 06:12 PM
The article reviews top AI voice generators like Google Cloud, Amazon Polly, Microsoft Azure, IBM Watson, and Descript, focusing on their features, voice quality, and suitability for different needs.
