

how to find standard deviation in excel

How to Find Standard Deviation in Excel
To find the standard deviation in Excel, you can follow these steps:
- Organize your data: Ensure that your data is organized in a column or row. For example, let's assume your data is in column A, from A1 to A10.
-
Select the function: Excel provides several functions to calculate standard deviation. The most commonly used functions are
STDEV.Pfor the entire population andSTDEV.Sfor a sample from a population. -
Enter the function: Click on an empty cell where you want the standard deviation to appear. Then, type the function. For example, if you're calculating the standard deviation for a sample, you would type
=STDEV.S(A1:A10). - Press Enter: After typing the function, press Enter. Excel will calculate and display the standard deviation in the selected cell.
- Check the result: Verify that the result makes sense in the context of your data. If the result seems off, double-check your data range and function choice.
What Are the Specific Excel Functions Used to Calculate Standard Deviation?
Excel provides several functions to calculate standard deviation, each suited for different scenarios:
-
STDEV.P: This function calculates the standard deviation based on an entire population. The syntax is
=STDEV.P(number1, [number2], ...). -
STDEV.S: This function calculates the standard deviation based on a sample from a population. The syntax is
=STDEV.S(number1, [number2], ...). -
STDEVA: This function calculates the standard deviation based on a sample, including text and logical values in the calculation. The syntax is
=STDEVA(value1, [value2], ...). -
STDEVPA: Similar to STDEVA, but calculates the standard deviation for the entire population. The syntax is
=STDEVPA(value1, [value2], ...).
These functions are essential tools in statistical analysis within Excel, allowing users to choose the appropriate function based on their dataset and analysis requirements.
Can You Explain How to Interpret the Standard Deviation Results in Excel?
Interpreting the standard deviation results in Excel involves understanding what the number represents and how it applies to your data:
- Measure of Spread: The standard deviation is a measure of the amount of variation or dispersion of a set of values. A low standard deviation indicates that the values tend to be close to the mean (average) of the set, while a high standard deviation indicates that the values are spread out over a wider range.
- Contextual Interpretation: The interpretation of the standard deviation depends on the context of the data. For example, in a set of test scores, a low standard deviation might indicate consistent performance across the group, whereas a high standard deviation might suggest varied performance levels.
- Comparison: Standard deviation can be used to compare the variability between different sets of data. For instance, if you are comparing the performance of two groups, the group with the lower standard deviation may be more consistent.
- Rule of Thumb: The "68-95-99.7 rule" (also known as the empirical rule) helps in interpreting the standard deviation: approximately 68% of the data falls within one standard deviation of the mean, 95% within two standard deviations, and 99.7% within three standard deviations.
Are There Any Common Mistakes to Avoid When Calculating Standard Deviation in Excel?
Yes, there are several common mistakes to avoid when calculating standard deviation in Excel:
-
Incorrect Function Use: Choosing the wrong function (e.g., using
STDEV.Pwhen you should be usingSTDEV.S) can lead to incorrect results. Ensure you understand whether you are working with a population or a sample. - Data Range Errors: Including or excluding cells that shouldn't be part of the calculation can skew your results. Always double-check the range of cells in your function.
-
Hidden or Filtered Data: If you have hidden rows or filtered data, Excel might still include these values in the calculation, which can affect your results. Use the
SUBTOTALfunction or filter-aware functions likeSTDEV.Swith caution. -
Non-Numeric Data: Entering non-numeric data into the calculation range can cause errors. Functions like
STDEV.Swill ignore text and logical values, butSTDEVAwill include them, which could lead to unexpected results. - Rounding Errors: Depending on the precision required, rounding errors might occur. It's generally a good practice to keep as many decimal places as possible until the final reporting stage.
By avoiding these common mistakes, you can ensure more accurate and reliable calculations of standard deviation in Excel.
The above is the detailed content of how to find standard deviation in excel. For more information, please follow other related articles on the PHP Chinese website!

Hot AI Tools

Undresser.AI Undress
AI-powered app for creating realistic nude photos

AI Clothes Remover
Online AI tool for removing clothes from photos.

Undress AI Tool
Undress images for free

Clothoff.io
AI clothes remover

Video Face Swap
Swap faces in any video effortlessly with our completely free AI face swap tool!

Hot Article
Hot Tools

Notepad++7.3.1
Easy-to-use and free code editor

SublimeText3 Chinese version
Chinese version, very easy to use

Zend Studio 13.0.1
Powerful PHP integrated development environment

Dreamweaver CS6
Visual web development tools

SublimeText3 Mac version
God-level code editing software (SublimeText3)
Hot Topics


 Excel formula to find top 3, 5, 10 values in column or row
Apr 01, 2025 am 05:09 AM
Excel formula to find top 3, 5, 10 values in column or row
Apr 01, 2025 am 05:09 AM
This tutorial demonstrates how to efficiently locate the top N values within a dataset and retrieve associated data using Excel formulas. Whether you need the highest, lowest, or those meeting specific criteria, this guide provides solutions. Findi
 How to add calendar to Outlook: shared, Internet calendar, iCal file
Apr 03, 2025 am 09:06 AM
How to add calendar to Outlook: shared, Internet calendar, iCal file
Apr 03, 2025 am 09:06 AM
This article explains how to access and utilize shared calendars within the Outlook desktop application, including importing iCalendar files. Previously, we covered sharing your Outlook calendar. Now, let's explore how to view calendars shared with
 How to use Flash Fill in Excel with examples
Apr 05, 2025 am 09:15 AM
How to use Flash Fill in Excel with examples
Apr 05, 2025 am 09:15 AM
This tutorial provides a comprehensive guide to Excel's Flash Fill feature, a powerful tool for automating data entry tasks. It covers various aspects, from its definition and location to advanced usage and troubleshooting. Understanding Excel's Fla
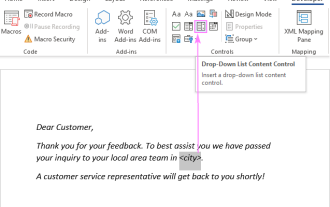 Add a dropdown list to Outlook email template
Apr 01, 2025 am 05:13 AM
Add a dropdown list to Outlook email template
Apr 01, 2025 am 05:13 AM
This tutorial shows you how to add dropdown lists to your Outlook email templates, including multiple selections and database population. While Outlook doesn't directly support dropdowns, this guide provides creative workarounds. Email templates sav
 MEDIAN formula in Excel - practical examples
Apr 11, 2025 pm 12:08 PM
MEDIAN formula in Excel - practical examples
Apr 11, 2025 pm 12:08 PM
This tutorial explains how to calculate the median of numerical data in Excel using the MEDIAN function. The median, a key measure of central tendency, identifies the middle value in a dataset, offering a more robust representation of central tenden
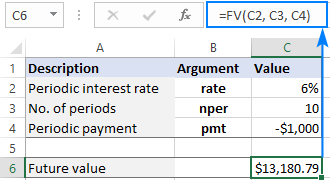 FV function in Excel to calculate future value
Apr 01, 2025 am 04:57 AM
FV function in Excel to calculate future value
Apr 01, 2025 am 04:57 AM
This tutorial explains how to use Excel's FV function to determine the future value of investments, encompassing both regular payments and lump-sum deposits. Effective financial planning hinges on understanding investment growth, and this guide prov
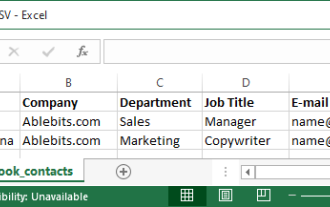 How to import contacts to Outlook (from CSV and PST file)
Apr 02, 2025 am 09:09 AM
How to import contacts to Outlook (from CSV and PST file)
Apr 02, 2025 am 09:09 AM
This tutorial demonstrates two methods for importing contacts into Outlook: using CSV and PST files, and also covers transferring contacts to Outlook Online. Whether you're consolidating data from an external source, migrating from another email pro
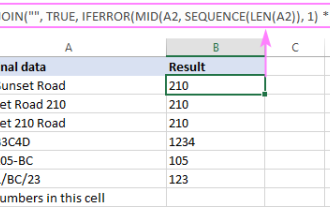 How to remove / split text and numbers in Excel cell
Apr 01, 2025 am 05:07 AM
How to remove / split text and numbers in Excel cell
Apr 01, 2025 am 05:07 AM
This tutorial demonstrates several methods for separating text and numbers within Excel cells, utilizing both built-in functions and custom VBA functions. You'll learn how to extract numbers while removing text, isolate text while discarding numbers
