
 Web Front-end
JS Tutorial
How do I use Java's JMX (Java Management Extensions) for monitoring and management?
Web Front-end
JS Tutorial
How do I use Java's JMX (Java Management Extensions) for monitoring and management?
How do I use Java's JMX (Java Management Extensions) for monitoring and management?

How to Use Java's JMX (Java Management Extensions) for Monitoring and Management
JMX (Java Management Extensions) is a powerful framework for monitoring and managing Java applications. It allows you to expose application-specific metrics and functionalities as manageable resources, called MBeans (Managed Beans). These MBeans can then be accessed and manipulated remotely using tools like JConsole or custom applications.
Here's a breakdown of how to use JMX:
-
Create MBeans: You need to create classes that implement the
javax.management.MXBeaninterface or extend thejavax.management.StandardMBeanclass. These classes will define the attributes and operations you want to expose for management. Attributes represent the data you want to monitor (e.g., memory usage, thread count), while operations represent actions you can perform (e.g., restarting a service, garbage collection). -
Register MBeans: Once you've created your MBeans, you need to register them with the MBean server. This is typically done using the
MBeanServerobject, which is obtained using theManagementFactory. You register an MBean by providing its object name, which uniquely identifies it within the MBean server. -
Access MBeans: After registration, you can access the registered MBeans using tools like JConsole (a built-in Java tool), or by writing custom clients that connect to the MBean server using the
JMXConnectorinterface. These tools and clients allow you to monitor the attributes and invoke the operations of your registered MBeans. - Example (Simple Counter MBean):
1 2 3 4 5 6 7 8 9 10 11 12 13 14 15 16 17 18 19 20 21 22 23 24 25 26 27 28 29 |
|
This example demonstrates a simple counter MBean. You would compile this code, run it, and then use JConsole to connect to the running JVM and view the count attribute and invoke the increment operation.
What are the Best Practices for Securing a JMX-Enabled Java Application?
Securing a JMX-enabled application is crucial, as it exposes management functionalities that could be exploited if not properly protected. Here are some best practices:
- Restrict JMX access: Don't expose the JMX port (typically 9090) directly to the internet. Use a firewall to restrict access only to trusted networks or IP addresses.
-
Authentication and Authorization: Configure authentication to require usernames and passwords to connect to the JMX server. This is often done using a
JMXAuthenticatorimplementation and configuring thejava.rmi.server.hostnameandcom.sun.management.jmxremote.portproperties. Implement authorization to control which users can access specific MBeans and operations. This can be done using aJMXAuthorizerimplementation. - SSL/TLS encryption: Enable SSL/TLS encryption to protect the communication between the JMX client and server. This requires configuring the appropriate SSL/TLS settings in the JVM options.
- Regular security audits: Regularly review your JMX configuration and access controls to ensure they are still appropriate and effective. Identify and address any vulnerabilities that may have been discovered.
- Least privilege: Only expose the MBeans and operations that are absolutely necessary for monitoring and management. Avoid exposing sensitive data or operations unnecessarily.
- Use strong passwords: Enforce strong passwords for JMX users, and regularly change them.
- Monitor JMX access: Log JMX connections and actions to detect unauthorized access attempts or suspicious activities.
How Can I Integrate JMX Monitoring with Existing Monitoring Tools Like Prometheus or Grafana?
Integrating JMX monitoring with tools like Prometheus or Grafana requires a JMX exporter that translates JMX metrics into a format that these tools can understand. Several options exist:
- Prometheus JMX Exporter: This is a popular open-source exporter that scrapes metrics from a JMX-enabled application and exposes them in the Prometheus exposition format. You would configure the exporter to connect to your application's JMX server, specify the MBeans to monitor, and then configure Prometheus to scrape the exporter's metrics endpoint. Grafana can then be configured to visualize the data from Prometheus.
- Custom Exporter: You can write a custom exporter that connects to your JMX server, retrieves the metrics, and exports them in a suitable format for your monitoring system. This gives you more control but requires more development effort.
- Jolokia: Jolokia is a JMX-to-JSON gateway that allows you to access JMX data via HTTP/JSON. This makes integration with various monitoring systems easier, including Prometheus and Grafana. You can use a Jolokia agent within your application or deploy a separate Jolokia server.
Regardless of the method chosen, the general process involves:
- Install and configure the exporter/gateway: Download and configure the chosen exporter or gateway to connect to your JMX-enabled application.
- Configure the exporter/gateway to expose desired metrics: Specify which MBeans and attributes you want to monitor.
- Configure Prometheus to scrape the exporter/gateway: Provide Prometheus with the URL of the exporter's metrics endpoint.
- Configure Grafana to visualize the data: Create dashboards in Grafana to visualize the metrics collected by Prometheus.
Can I Use JMX to Remotely Manage and Troubleshoot My Java Applications?
Yes, JMX is specifically designed for remote management and troubleshooting of Java applications. By exposing relevant MBeans, you can remotely:
- Monitor performance metrics: Track CPU usage, memory consumption, garbage collection statistics, thread activity, and other key performance indicators.
- Control application behavior: Invoke operations to perform actions such as restarting services, clearing caches, or changing configuration settings.
- Inspect application state: Access attributes to view the current state of your application, such as the number of active connections, queue sizes, or data in various caches.
- Diagnose problems: Identify bottlenecks, resource leaks, or other issues by examining various metrics and application state information.
Remote access is achieved by configuring the JMX server to accept remote connections and then using a JMX client (like JConsole or a custom client) to connect to the remote JMX server. Remember to secure this remote access using the best practices mentioned earlier. The ability to remotely manage and troubleshoot significantly improves the maintainability and operational efficiency of your Java applications.
The above is the detailed content of How do I use Java's JMX (Java Management Extensions) for monitoring and management?. For more information, please follow other related articles on the PHP Chinese website!

Hot AI Tools

Undresser.AI Undress
AI-powered app for creating realistic nude photos

AI Clothes Remover
Online AI tool for removing clothes from photos.

Undress AI Tool
Undress images for free

Clothoff.io
AI clothes remover

Video Face Swap
Swap faces in any video effortlessly with our completely free AI face swap tool!
Hot Article
Hot Tools

Notepad++7.3.1
Easy-to-use and free code editor

SublimeText3 Chinese version
Chinese version, very easy to use

Zend Studio 13.0.1
Powerful PHP integrated development environment

Dreamweaver CS6
Visual web development tools

SublimeText3 Mac version
God-level code editing software (SublimeText3)
Hot Topics
 1664
1664
 14
1421
52
1315
25
1266
29
1239
24
14
1421
52
1315
25
1266
29
1239
24

 Demystifying JavaScript: What It Does and Why It Matters
Apr 09, 2025 am 12:07 AM
Demystifying JavaScript: What It Does and Why It Matters
Apr 09, 2025 am 12:07 AM
JavaScript is the cornerstone of modern web development, and its main functions include event-driven programming, dynamic content generation and asynchronous programming. 1) Event-driven programming allows web pages to change dynamically according to user operations. 2) Dynamic content generation allows page content to be adjusted according to conditions. 3) Asynchronous programming ensures that the user interface is not blocked. JavaScript is widely used in web interaction, single-page application and server-side development, greatly improving the flexibility of user experience and cross-platform development.
 The Evolution of JavaScript: Current Trends and Future Prospects
Apr 10, 2025 am 09:33 AM
The Evolution of JavaScript: Current Trends and Future Prospects
Apr 10, 2025 am 09:33 AM
The latest trends in JavaScript include the rise of TypeScript, the popularity of modern frameworks and libraries, and the application of WebAssembly. Future prospects cover more powerful type systems, the development of server-side JavaScript, the expansion of artificial intelligence and machine learning, and the potential of IoT and edge computing.
 JavaScript Engines: Comparing Implementations
Apr 13, 2025 am 12:05 AM
JavaScript Engines: Comparing Implementations
Apr 13, 2025 am 12:05 AM
Different JavaScript engines have different effects when parsing and executing JavaScript code, because the implementation principles and optimization strategies of each engine differ. 1. Lexical analysis: convert source code into lexical unit. 2. Grammar analysis: Generate an abstract syntax tree. 3. Optimization and compilation: Generate machine code through the JIT compiler. 4. Execute: Run the machine code. V8 engine optimizes through instant compilation and hidden class, SpiderMonkey uses a type inference system, resulting in different performance performance on the same code.
 Python vs. JavaScript: The Learning Curve and Ease of Use
Apr 16, 2025 am 12:12 AM
Python vs. JavaScript: The Learning Curve and Ease of Use
Apr 16, 2025 am 12:12 AM
Python is more suitable for beginners, with a smooth learning curve and concise syntax; JavaScript is suitable for front-end development, with a steep learning curve and flexible syntax. 1. Python syntax is intuitive and suitable for data science and back-end development. 2. JavaScript is flexible and widely used in front-end and server-side programming.
 JavaScript: Exploring the Versatility of a Web Language
Apr 11, 2025 am 12:01 AM
JavaScript: Exploring the Versatility of a Web Language
Apr 11, 2025 am 12:01 AM
JavaScript is the core language of modern web development and is widely used for its diversity and flexibility. 1) Front-end development: build dynamic web pages and single-page applications through DOM operations and modern frameworks (such as React, Vue.js, Angular). 2) Server-side development: Node.js uses a non-blocking I/O model to handle high concurrency and real-time applications. 3) Mobile and desktop application development: cross-platform development is realized through ReactNative and Electron to improve development efficiency.
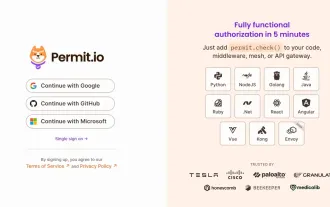
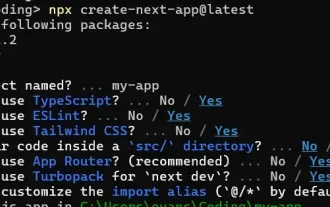 How to Build a Multi-Tenant SaaS Application with Next.js (Frontend Integration)
Apr 11, 2025 am 08:22 AM
How to Build a Multi-Tenant SaaS Application with Next.js (Frontend Integration)
Apr 11, 2025 am 08:22 AM
This article demonstrates frontend integration with a backend secured by Permit, building a functional EdTech SaaS application using Next.js. The frontend fetches user permissions to control UI visibility and ensures API requests adhere to role-base
 From C/C to JavaScript: How It All Works
Apr 14, 2025 am 12:05 AM
From C/C to JavaScript: How It All Works
Apr 14, 2025 am 12:05 AM
The shift from C/C to JavaScript requires adapting to dynamic typing, garbage collection and asynchronous programming. 1) C/C is a statically typed language that requires manual memory management, while JavaScript is dynamically typed and garbage collection is automatically processed. 2) C/C needs to be compiled into machine code, while JavaScript is an interpreted language. 3) JavaScript introduces concepts such as closures, prototype chains and Promise, which enhances flexibility and asynchronous programming capabilities.
 Building a Multi-Tenant SaaS Application with Next.js (Backend Integration)
Apr 11, 2025 am 08:23 AM
Building a Multi-Tenant SaaS Application with Next.js (Backend Integration)
Apr 11, 2025 am 08:23 AM
I built a functional multi-tenant SaaS application (an EdTech app) with your everyday tech tool and you can do the same. First, what’s a multi-tenant SaaS application? Multi-tenant SaaS applications let you serve multiple customers from a sing
