
 Database
Mysql Tutorial
Mastering MySQL: Key Performance Metrics Every Developer Should Monitor
Database
Mysql Tutorial
Mastering MySQL: Key Performance Metrics Every Developer Should Monitor
Mastering MySQL: Key Performance Metrics Every Developer Should Monitor

Monitoring MySQL performance metrics and managing your database doesn’t need to be difficult. Yes, you heard that right. With the proper monitoring strategies and tools at your disposal, you can finally take a backseat. The RED method, paired with Releem’s powerful monitoring capabilities and easy-to-apply configuration recommendations, does the heavy lifting for you.
Introduction to the RED Method
The RED method is traditionally used for monitoring the performance of web applications and services but can also be applied to MySQL performance monitoring. Releem has found the framework to be equally valuable in monitoring MySQL performance metrics because the challenges faced by databases, in terms of performance and reliability, mirror those encountered by web applications.
When applied to MySQL databases, the RED method breaks down into three critical areas of concern, each providing insights into your database's operational health:
Query Rate (Rate) – This assesses the volume of queries or commands executed per second, offering a direct measure of the server's workload. It's instrumental in evaluating the database's ability to handle concurrent operations and its responsiveness to user demands.
Error Rate (Errors) – Tracking the frequency of errors in queries sheds light on potential reliability issues within the database. A high error rate may indicate underlying problems with query syntax, database schema, or system constraints that are affecting the overall database integrity. The primary MySQL metric for monitoring rate is Aborted_clients.
Query Execution Duration (Duration) – The duration metric is a measure of the time it takes for queries to complete, from initiation to execution. This performance indicator assesses the efficiency of data retrieval and processing operations which have direct impacts on the user experience and system throughput.
The health of these metrics gives you a solid understanding of how your database is performing and in turn, the experience your users are having. The RED method makes it easy to gauge what is wrong with your database and what needs to be fixed. For instance, should you find that queries are sluggishly executing, it might signal the need for tweaking indexes or optimizing the affected queries to boost efficiency.
8 MySQL Performance Metrics Essential to the RED Method
To apply the RED method effectively to MySQL performance monitoring, Releem zeros in on eight critical aspects of your database. Each of these is tied back to Rate, Errors, or Duration in one way or another:
1. MySQL Latency
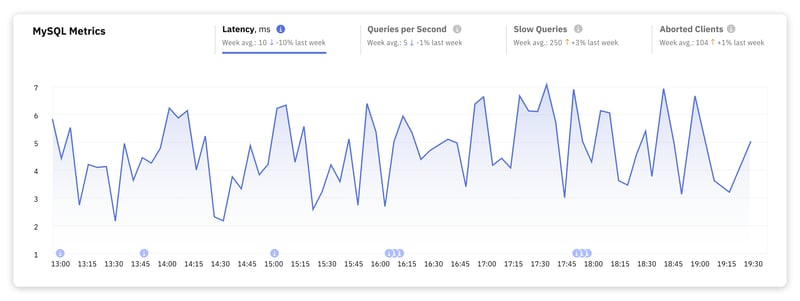
Latency measures the time it takes to execute a query – from the moment a query is sent to the database until the database responds. Latency directly influences how users perceive your application.
For most web applications, achieving a latency in the range of a few milliseconds up to about 10 milliseconds for database operations is considered excellent. This range ensures a seamless user experience, as the delay is virtually imperceptible to the end user.
Once latency hits the 100 milliseconds mark and beyond for simple to moderately complex queries, users start to notice a delay. This can become problematic where immediate feedback is critical, such as in form submissions, search queries, or dynamic content loading.
For More On MySQL Latency
2. Throughput
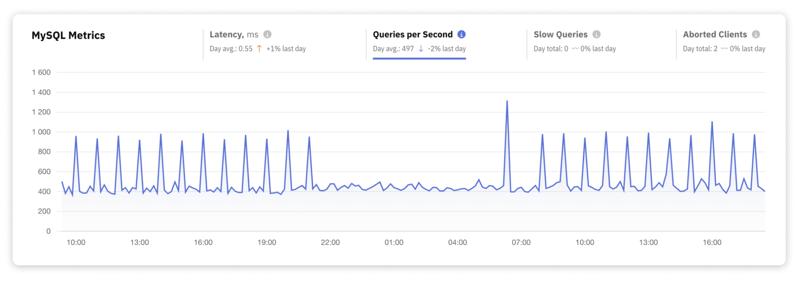
Throughput, quantified as Queries per Second (QPS), gauges your database's efficiency and its capacity to manage workloads. High throughput signifies a well-optimized database system that can handle significant query volumes efficiently. Low throughput may indicate performance bottlenecks or resource limitations.
Achieving high throughput typically involves a combination of optimized SQL queries, appropriate hardware resources (CPU, memory, and fast IO subsystems), and fine-tuned database configurations.
For More on Throughput
3. Slow Queries Count
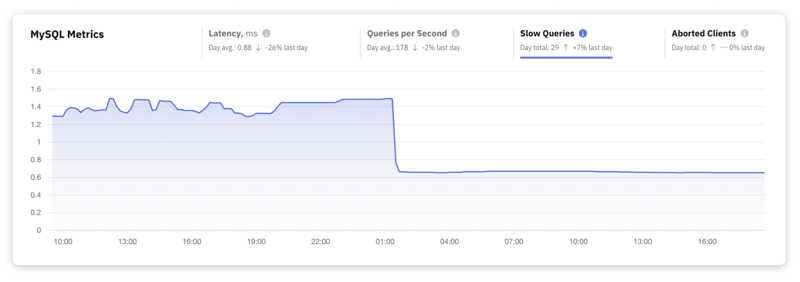
Slow queries are essentially database requests that breach a predefined execution time threshold. You can tune this threshold to suit your specific performance objectives or operational benchmarks. Tracking the count of slow queries is how you go about identifying queries that need optimization.
The identification and logging of these slow queries take place in the slow_query_log, a dedicated file created for storing details about queries that fail to meet the set performance standards.
For More on Slow Queries Count
4. Aborted Clients
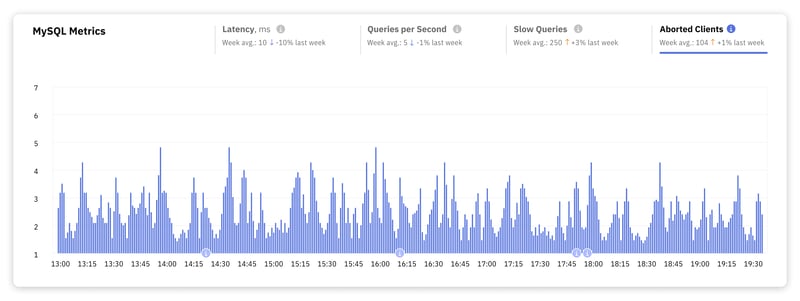
This metric counts the number of connections that were aborted because the client did not properly close the connection. High numbers of aborted clients can indicate a range of causes:
- Network latency and jitter causing timeouts
- Server capacity limits leading to connection rejections
- Resource contention among queries
- Inefficiencies from long-running queries
- Misconfigurations in MySQL settings
- Application errors triggering premature disconnections
For More on Aborted Clients
5. CPU Usage
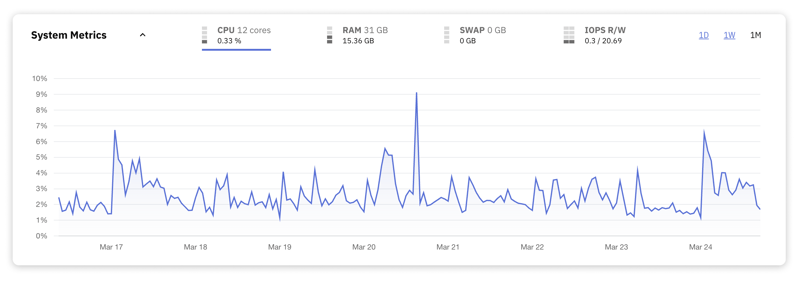
The CPU is your server's brain. It executes commands and performs calculations that allow your database to store, retrieve, modify, and delete data. Keeping a close eye on CPU usage helps ensure that the server has enough processing power to handle its workload. High CPU usage can be a telltale sign of an overloaded server struggling to keep up with the demands placed on it.
Here are some general guidelines to consider for CPU usage:
50-70% Sustained – At this level, your CPU is handling a moderate to heavy workload effectively, but there's still some headroom for peak loads. It's a healthy range for servers under normal operation.
70-90% Sustained – When CPU usage consistently falls within this range, it indicates a high workload that leaves limited room for handling peak demands. You should monitor the server closely.
Above 90% Sustained – This is a strong indicator that the server is nearing or at its capacity. Noticeable performance issues, including slow query response times and potential timeouts, are likely. It’s critical to investigate the cause and implement optimizations or scale resources accordingly.
Note: Occasional spikes above these thresholds may not necessarily indicate a problem, as databases are designed to handle variable loads. The key word is sustained. High sustained usage is a sign that your server is under significant strain.
6. RAM Usage
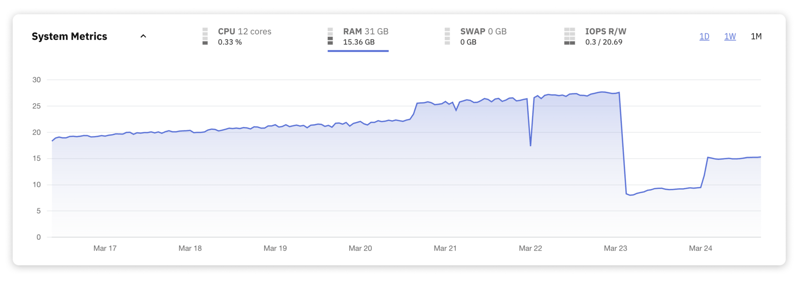
RAM is a key resource for databases, as it stores active data and indexes, allowing for quick access and efficient query processing. Proper management of RAM usage ensures that the database can handle workloads efficiently, optimizing both data retrieval and manipulation operations.
Here are some general guidelines to consider for RAM usage:
<60-70% Utilization – This range is generally considered safe and indicates that there's sufficient memory available for both current database operations and additional workload spikes.
70-85% Utilization – When RAM usage consistently falls within this range, it suggests that the database is making good use of the available memory but is starting to reach the threshold for careful monitoring. Staying in this range during peak times may limit the buffer for handling sudden increases in demand.
85-90% Utilization – In this range, the server is nearing its memory capacity. High memory utilization can lead to increased disk I/O as the system starts swapping data to and from the disk. Consider this a warning sign that either the workload needs to be optimized or the server's physical memory needs to be expanded.
>95% Utilization – Operating at or above 95% RAM usage is critical and likely to cause performance issues. At this level, the server may frequently resort to swapping, leading to severe slowdowns and potentially causing timeouts for client applications. Immediate action is required on your part.
7. SWAP Usage
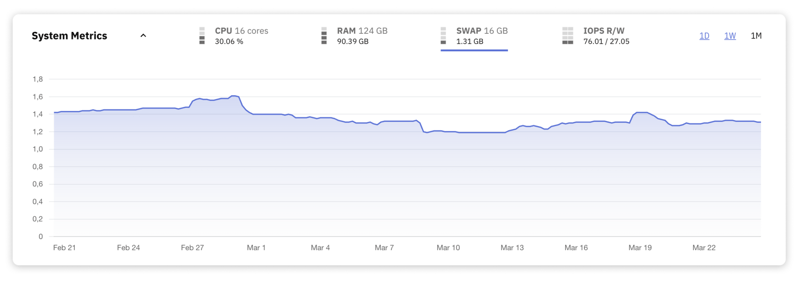
SWAP space is used when the physical RAM of your DB is fully utilized, allowing the system to offload some of the less frequently accessed data to disk storage. While this mechanism is a helpful buffer against out-of-memory errors, relying on SWAP can severely impact performance due to the significantly slower access times compared to RAM.
Ideally, a MySQL server should exhibit low to minimal SWAP usage. This indicates that the database is operating within its available RAM.
High SWAP usage is a red flag indicating that the server's physical memory is insufficient for its workload, forcing it to depend on disk space for routine data operations. You should take immediate steps to address this, by optimizing the application's memory demands or by scaling up the server's RAM.
8. Input/Output Operations per Second (IOPS)
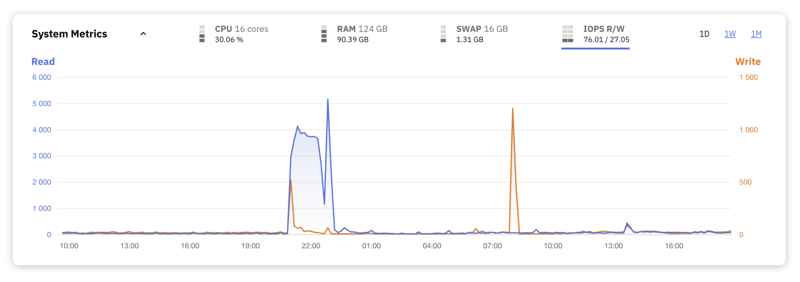
The Input/Output Operations per Second (IOPS) metric indicates how intensively your database interacts with its underlying storage system – aka the disk. High levels of IOPS signify a heavy load of data being transferred to and from the storage media, which, while indicative of a busy database, can also highlight potential bottlenecks in disk performance.
Some key factors influencing IOPS include:
- The type of storage media, with SSDs typically outperforming HDDs in speed
- RAID configurations, which can optimize for read or write operations
- The specific demands of the database workload, whether read-heavy or write-intensive
- The level of concurrency and effectiveness of caching strategies
Releem’s Comprehensive Strategy for Database Management
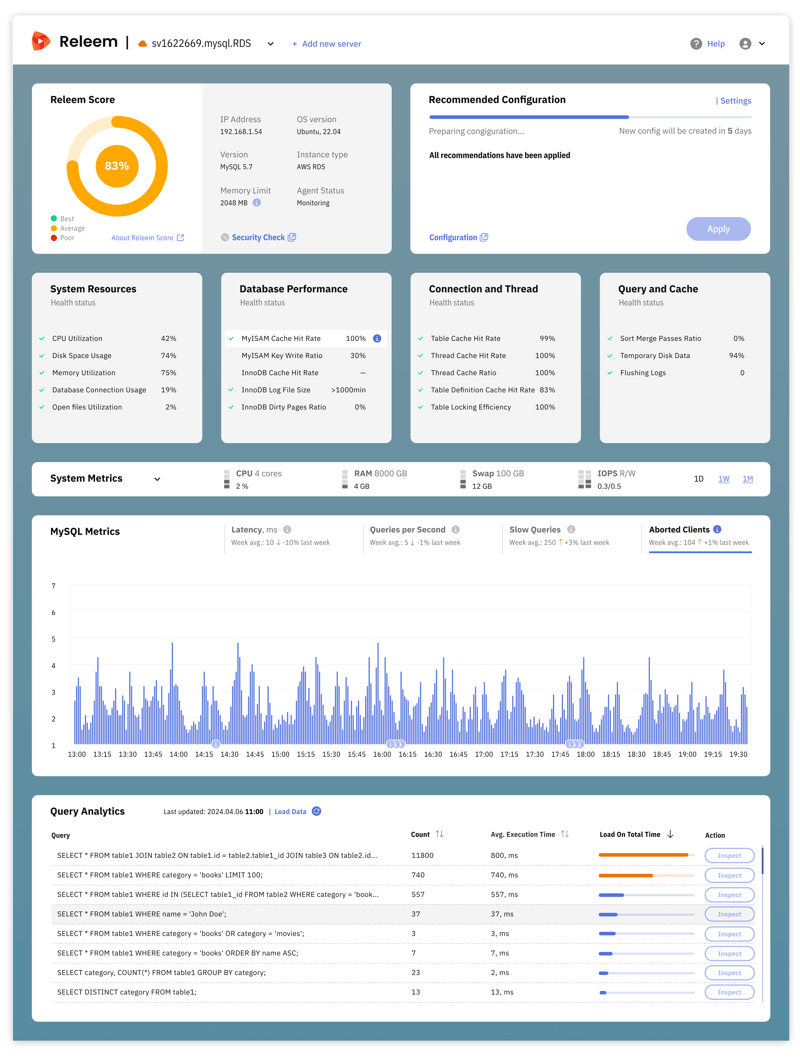
Releem's approach to MySQL performance monitoring is about keeping a keen eye on the important details. This strategy includes diligent tracking of the 8 metrics mentioned – MySQL latency, throughput, slow queries, aborted clients, CPU, RAM, SWAP usage, and IOPS – all within the framework of the RED Method. By integrating this monitoring as part of the twice-daily Health Checks (19 metrics!), Releem helps your database achieve and maintain high levels of performance, reliability, and scalability.
Beyond just keeping tabs on MySQL performance, Releem goes a step further by offering tailored configuration suggestions aimed at fixing any snags uncovered during monitoring. We call this feature Autopilot for MySQL. For example, if you are having problems with high latency, Releem will provide actionable insights to get your latency numbers back in line. Our ultimate goal is to remove the need for manual oversight with powerful, intuitive software that handles all the complexities of database management that you'd rather not worry about.
Releem has wide-ranging compatibility, so whether you use Percona, MySQL, or MariaDB for your database management system – Releem can help. Check out the official list of supported systems here.
For an in-depth exploration of each metric and best practices for MySQL database monitoring and optimization, consider visiting Releem.com.
The above is the detailed content of Mastering MySQL: Key Performance Metrics Every Developer Should Monitor. For more information, please follow other related articles on the PHP Chinese website!

Hot AI Tools

Undresser.AI Undress
AI-powered app for creating realistic nude photos

AI Clothes Remover
Online AI tool for removing clothes from photos.

Undress AI Tool
Undress images for free

Clothoff.io
AI clothes remover

Video Face Swap
Swap faces in any video effortlessly with our completely free AI face swap tool!

Hot Article
Hot Tools

Notepad++7.3.1
Easy-to-use and free code editor

SublimeText3 Chinese version
Chinese version, very easy to use

Zend Studio 13.0.1
Powerful PHP integrated development environment

Dreamweaver CS6
Visual web development tools

SublimeText3 Mac version
God-level code editing software (SublimeText3)
Hot Topics
 1668
1668
 14
1428
52
1329
25
1273
29
1256
24
14
1428
52
1329
25
1273
29
1256
24

 MySQL's Role: Databases in Web Applications
Apr 17, 2025 am 12:23 AM
MySQL's Role: Databases in Web Applications
Apr 17, 2025 am 12:23 AM
The main role of MySQL in web applications is to store and manage data. 1.MySQL efficiently processes user information, product catalogs, transaction records and other data. 2. Through SQL query, developers can extract information from the database to generate dynamic content. 3.MySQL works based on the client-server model to ensure acceptable query speed.
 Explain the role of InnoDB redo logs and undo logs.
Apr 15, 2025 am 12:16 AM
Explain the role of InnoDB redo logs and undo logs.
Apr 15, 2025 am 12:16 AM
InnoDB uses redologs and undologs to ensure data consistency and reliability. 1.redologs record data page modification to ensure crash recovery and transaction persistence. 2.undologs records the original data value and supports transaction rollback and MVCC.
 MySQL's Place: Databases and Programming
Apr 13, 2025 am 12:18 AM
MySQL's Place: Databases and Programming
Apr 13, 2025 am 12:18 AM
MySQL's position in databases and programming is very important. It is an open source relational database management system that is widely used in various application scenarios. 1) MySQL provides efficient data storage, organization and retrieval functions, supporting Web, mobile and enterprise-level systems. 2) It uses a client-server architecture, supports multiple storage engines and index optimization. 3) Basic usages include creating tables and inserting data, and advanced usages involve multi-table JOINs and complex queries. 4) Frequently asked questions such as SQL syntax errors and performance issues can be debugged through the EXPLAIN command and slow query log. 5) Performance optimization methods include rational use of indexes, optimized query and use of caches. Best practices include using transactions and PreparedStatemen
 MySQL vs. Other Programming Languages: A Comparison
Apr 19, 2025 am 12:22 AM
MySQL vs. Other Programming Languages: A Comparison
Apr 19, 2025 am 12:22 AM
Compared with other programming languages, MySQL is mainly used to store and manage data, while other languages such as Python, Java, and C are used for logical processing and application development. MySQL is known for its high performance, scalability and cross-platform support, suitable for data management needs, while other languages have advantages in their respective fields such as data analytics, enterprise applications, and system programming.
 MySQL: From Small Businesses to Large Enterprises
Apr 13, 2025 am 12:17 AM
MySQL: From Small Businesses to Large Enterprises
Apr 13, 2025 am 12:17 AM
MySQL is suitable for small and large enterprises. 1) Small businesses can use MySQL for basic data management, such as storing customer information. 2) Large enterprises can use MySQL to process massive data and complex business logic to optimize query performance and transaction processing.
 How does MySQL index cardinality affect query performance?
Apr 14, 2025 am 12:18 AM
How does MySQL index cardinality affect query performance?
Apr 14, 2025 am 12:18 AM
MySQL index cardinality has a significant impact on query performance: 1. High cardinality index can more effectively narrow the data range and improve query efficiency; 2. Low cardinality index may lead to full table scanning and reduce query performance; 3. In joint index, high cardinality sequences should be placed in front to optimize query.
 MySQL for Beginners: Getting Started with Database Management
Apr 18, 2025 am 12:10 AM
MySQL for Beginners: Getting Started with Database Management
Apr 18, 2025 am 12:10 AM
The basic operations of MySQL include creating databases, tables, and using SQL to perform CRUD operations on data. 1. Create a database: CREATEDATABASEmy_first_db; 2. Create a table: CREATETABLEbooks(idINTAUTO_INCREMENTPRIMARYKEY, titleVARCHAR(100)NOTNULL, authorVARCHAR(100)NOTNULL, published_yearINT); 3. Insert data: INSERTINTObooks(title, author, published_year)VA
 MySQL vs. Other Databases: Comparing the Options
Apr 15, 2025 am 12:08 AM
MySQL vs. Other Databases: Comparing the Options
Apr 15, 2025 am 12:08 AM
MySQL is suitable for web applications and content management systems and is popular for its open source, high performance and ease of use. 1) Compared with PostgreSQL, MySQL performs better in simple queries and high concurrent read operations. 2) Compared with Oracle, MySQL is more popular among small and medium-sized enterprises because of its open source and low cost. 3) Compared with Microsoft SQL Server, MySQL is more suitable for cross-platform applications. 4) Unlike MongoDB, MySQL is more suitable for structured data and transaction processing.
