
 Web Front-end
JS Tutorial
How to implement adaptive scaling of JS web page images_javascript skills
Web Front-end
JS Tutorial
How to implement adaptive scaling of JS web page images_javascript skills
How to implement adaptive scaling of JS web page images_javascript skills

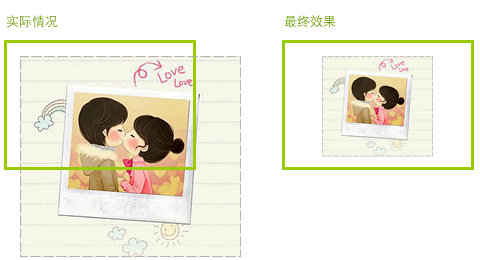
The user uploads a photo, and the size of the photo is unknown; a preview needs to be generated. This preview image must be applied according to the area provided to the user for preview and centered; if the image is too large, it needs to be scaled proportionally. As shown below.
Having a quick look, centering can be achieved using text-align:center;. However, proportional scaling cannot be solved by using the width and height attributes of the default . Because the user picture may be very long or very wide. I thought about their relationship online and judged it based on the conditions:
if(actual width > preview maximum width) {
Zoom width = preview maximum width
}
if(actual height> preview maximum height) {
Scaled height = preview maximum height
}
But there will be problems, such as when the width and height are both scaled, if the scaling is different, The image will not be scaled proportionally and will become very ugly. In order to make it scale proportionally, various judgments need to be made. Then this goes against the principle of automating the program we want. Thinking about it again, although I don’t like mathematics, mathematics is still very useful, and there should be other ways. And since it is scaled proportionally, why not use the ratio between the actual image and the width of the preview area to calculate their relationship? hmmmm... It's really OK. In fact we only ever need to scale either width or height. Because the ratio is only for large and small species. Specifically, write a function to implement it:
/ **
* Image adaptive scaling
* @param img {Element} User uploaded image
* @param maxWidth {Number} Maximum width of the preview area
* @param maxHeight {Number} Preview The maximum height of the area
*/
var resizeImg = function(img, maxWidth, maxHeight){
var w = img.width,
h = img.height;
// When the picture does not make any changes than the preview area,
IF (w & lt; maxwidth && h & lt; maxheight) Return;
// When the actual picture ratio is greater than the width ratio of the preview area,
// Scaling picture width, otherwise the width of the zoom
w/h & gt; maxwidth/maxheight? Img.width = maxwidth: img.height = maxHeight;

Hot AI Tools

Undresser.AI Undress
AI-powered app for creating realistic nude photos

AI Clothes Remover
Online AI tool for removing clothes from photos.

Undress AI Tool
Undress images for free

Clothoff.io
AI clothes remover

Video Face Swap
Swap faces in any video effortlessly with our completely free AI face swap tool!

Hot Article
Hot Tools

Notepad++7.3.1
Easy-to-use and free code editor

SublimeText3 Chinese version
Chinese version, very easy to use

Zend Studio 13.0.1
Powerful PHP integrated development environment

Dreamweaver CS6
Visual web development tools

SublimeText3 Mac version
God-level code editing software (SublimeText3)
Hot Topics


 Recommended: Excellent JS open source face detection and recognition project
Apr 03, 2024 am 11:55 AM
Recommended: Excellent JS open source face detection and recognition project
Apr 03, 2024 am 11:55 AM
Face detection and recognition technology is already a relatively mature and widely used technology. Currently, the most widely used Internet application language is JS. Implementing face detection and recognition on the Web front-end has advantages and disadvantages compared to back-end face recognition. Advantages include reducing network interaction and real-time recognition, which greatly shortens user waiting time and improves user experience; disadvantages include: being limited by model size, the accuracy is also limited. How to use js to implement face detection on the web? In order to implement face recognition on the Web, you need to be familiar with related programming languages and technologies, such as JavaScript, HTML, CSS, WebRTC, etc. At the same time, you also need to master relevant computer vision and artificial intelligence technologies. It is worth noting that due to the design of the Web side
 How to use JS and Baidu Maps to implement map pan function
Nov 21, 2023 am 10:00 AM
How to use JS and Baidu Maps to implement map pan function
Nov 21, 2023 am 10:00 AM
How to use JS and Baidu Map to implement map pan function Baidu Map is a widely used map service platform, which is often used in web development to display geographical information, positioning and other functions. This article will introduce how to use JS and Baidu Map API to implement the map pan function, and provide specific code examples. 1. Preparation Before using Baidu Map API, you first need to apply for a developer account on Baidu Map Open Platform (http://lbsyun.baidu.com/) and create an application. Creation completed
 Essential tools for stock analysis: Learn the steps to draw candle charts with PHP and JS
Dec 17, 2023 pm 06:55 PM
Essential tools for stock analysis: Learn the steps to draw candle charts with PHP and JS
Dec 17, 2023 pm 06:55 PM
Essential tools for stock analysis: Learn the steps to draw candle charts in PHP and JS. Specific code examples are required. With the rapid development of the Internet and technology, stock trading has become one of the important ways for many investors. Stock analysis is an important part of investor decision-making, and candle charts are widely used in technical analysis. Learning how to draw candle charts using PHP and JS will provide investors with more intuitive information to help them make better decisions. A candlestick chart is a technical chart that displays stock prices in the form of candlesticks. It shows the stock price
 How to create a stock candlestick chart using PHP and JS
Dec 17, 2023 am 08:08 AM
How to create a stock candlestick chart using PHP and JS
Dec 17, 2023 am 08:08 AM
How to use PHP and JS to create a stock candle chart. A stock candle chart is a common technical analysis graphic in the stock market. It helps investors understand stocks more intuitively by drawing data such as the opening price, closing price, highest price and lowest price of the stock. price fluctuations. This article will teach you how to create stock candle charts using PHP and JS, with specific code examples. 1. Preparation Before starting, we need to prepare the following environment: 1. A server running PHP 2. A browser that supports HTML5 and Canvas 3
 How to use JS and Baidu Map to implement map click event processing function
Nov 21, 2023 am 11:11 AM
How to use JS and Baidu Map to implement map click event processing function
Nov 21, 2023 am 11:11 AM
Overview of how to use JS and Baidu Maps to implement map click event processing: In web development, it is often necessary to use map functions to display geographical location and geographical information. Click event processing on the map is a commonly used and important part of the map function. This article will introduce how to use JS and Baidu Map API to implement the click event processing function of the map, and give specific code examples. Steps: Import the API file of Baidu Map. First, import the file of Baidu Map API in the HTML file. This can be achieved through the following code:
 How to use JS and Baidu Maps to implement map heat map function
Nov 21, 2023 am 09:33 AM
How to use JS and Baidu Maps to implement map heat map function
Nov 21, 2023 am 09:33 AM
How to use JS and Baidu Maps to implement the map heat map function Introduction: With the rapid development of the Internet and mobile devices, maps have become a common application scenario. As a visual display method, heat maps can help us understand the distribution of data more intuitively. This article will introduce how to use JS and Baidu Map API to implement the map heat map function, and provide specific code examples. Preparation work: Before starting, you need to prepare the following items: a Baidu developer account, create an application, and obtain the corresponding AP
 PHP and JS Development Tips: Master the Method of Drawing Stock Candle Charts
Dec 18, 2023 pm 03:39 PM
PHP and JS Development Tips: Master the Method of Drawing Stock Candle Charts
Dec 18, 2023 pm 03:39 PM
With the rapid development of Internet finance, stock investment has become the choice of more and more people. In stock trading, candle charts are a commonly used technical analysis method. It can show the changing trend of stock prices and help investors make more accurate decisions. This article will introduce the development skills of PHP and JS, lead readers to understand how to draw stock candle charts, and provide specific code examples. 1. Understanding Stock Candle Charts Before introducing how to draw stock candle charts, we first need to understand what a candle chart is. Candlestick charts were developed by the Japanese
 The relationship between js and vue
Mar 11, 2024 pm 05:21 PM
The relationship between js and vue
Mar 11, 2024 pm 05:21 PM
The relationship between js and vue: 1. JS as the cornerstone of Web development; 2. The rise of Vue.js as a front-end framework; 3. The complementary relationship between JS and Vue; 4. The practical application of JS and Vue.
