

Sql Server统计表中某年某月某个值有多少?

比如:统计表AA中YWLX列在某年某月每种类型各有多少? select year(AA_YWRQ) as YEARS, month(AA_YWRQ) AS Months ,AA_YWLX,count(AA_YWLX) as Number from AA group by year(AA_YWRQ), month(AA_YWRQ),AA_YWLX 表中数据: 查询后的结果:
比如:统计表AA中YWLX列在某年某月每种类型各有多少?
select
year(AA_YWRQ) as YEARS,
month(AA_YWRQ) AS Months ,AA_YWLX,count(AA_YWLX) as Number
from AA
group by year(AA_YWRQ),
month(AA_YWRQ),AA_YWLX
表中数据:

查询后的结果:


Hot AI Tools

Undresser.AI Undress
AI-powered app for creating realistic nude photos

AI Clothes Remover
Online AI tool for removing clothes from photos.

Undress AI Tool
Undress images for free

Clothoff.io
AI clothes remover

Video Face Swap
Swap faces in any video effortlessly with our completely free AI face swap tool!

Hot Article
Hot Tools

Notepad++7.3.1
Easy-to-use and free code editor

SublimeText3 Chinese version
Chinese version, very easy to use

Zend Studio 13.0.1
Powerful PHP integrated development environment

Dreamweaver CS6
Visual web development tools

SublimeText3 Mac version
God-level code editing software (SublimeText3)
Hot Topics
 1658
1658
 14
1415
52
1309
25
1257
29
1231
24
14
1415
52
1309
25
1257
29
1231
24

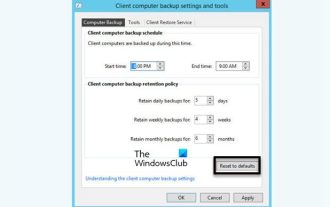 How to install, uninstall, and reset Windows server backup
Mar 06, 2024 am 10:37 AM
How to install, uninstall, and reset Windows server backup
Mar 06, 2024 am 10:37 AM
WindowsServerBackup is a function that comes with the WindowsServer operating system, designed to help users protect important data and system configurations, and provide complete backup and recovery solutions for small, medium and enterprise-level enterprises. Only users running Server2022 and higher can use this feature. In this article, we will explain how to install, uninstall or reset WindowsServerBackup. How to Reset Windows Server Backup If you are experiencing problems with your server backup, the backup is taking too long, or you are unable to access stored files, then you may consider resetting your Windows Server backup settings. To reset Windows
 Implementation of linear and pie chart functions in Vue statistical charts
Aug 19, 2023 pm 06:13 PM
Implementation of linear and pie chart functions in Vue statistical charts
Aug 19, 2023 pm 06:13 PM
The linear and pie chart functions of Vue statistical charts are implemented in the field of data analysis and visualization. Statistical charts are a very commonly used tool. As a popular JavaScript framework, Vue provides convenient methods to implement various functions, including the display and interaction of statistical charts. This article will introduce how to use Vue to implement linear and pie chart functions, and provide corresponding code examples. Linear graph function implementation A linear graph is a type of chart used to display trends and changes in data. In Vue, we can use some excellent
 How to implement data statistics and analysis in uniapp
Oct 24, 2023 pm 12:37 PM
How to implement data statistics and analysis in uniapp
Oct 24, 2023 pm 12:37 PM
How to implement data statistics and analysis in uniapp 1. Background introduction Data statistics and analysis are a very important part of the mobile application development process. Through statistics and analysis of user behavior, developers can have an in-depth understanding of user preferences and usage habits. Thereby optimizing product design and user experience. This article will introduce how to implement data statistics and analysis functions in uniapp, and provide some specific code examples. 2. Choose appropriate data statistics and analysis tools. The first step to implement data statistics and analysis in uniapp is to choose the appropriate data statistics and analysis tools.
 Use Google Analytics to count website data in Beego
Jun 22, 2023 am 09:19 AM
Use Google Analytics to count website data in Beego
Jun 22, 2023 am 09:19 AM
With the rapid development of the Internet, the use of Web applications is becoming more and more common. How to monitor and analyze the usage of Web applications has become a focus of developers and website operators. Google Analytics is a powerful website analytics tool that can track and analyze the behavior of website visitors. This article will introduce how to use Google Analytics in Beego to collect website data. 1. To register a Google Analytics account, you first need to
 How to quickly build a statistical chart system under the Vue framework
Aug 21, 2023 pm 05:48 PM
How to quickly build a statistical chart system under the Vue framework
Aug 21, 2023 pm 05:48 PM
How to quickly build a statistical chart system under the Vue framework. In modern web applications, statistical charts are an essential component. As a popular front-end framework, Vue.js provides many convenient tools and components that can help us quickly build a statistical chart system. This article will introduce how to use the Vue framework and some plug-ins to build a simple statistical chart system. First, we need to prepare a Vue.js development environment, including installing Vue scaffolding and some related plug-ins. Execute the following command in the command line
 Steps of statistical analysis
Jun 28, 2023 pm 03:27 PM
Steps of statistical analysis
Jun 28, 2023 pm 03:27 PM
Statistical analysis often refers to the process of sorting, classifying and interpreting collected relevant data. The basic steps of statistical analysis include: 1. Collect data; 2. Organize data; 3. Analyze data.
 How to use MySQL's COUNT function to count the number of rows in a data table
Jul 25, 2023 pm 02:09 PM
How to use MySQL's COUNT function to count the number of rows in a data table
Jul 25, 2023 pm 02:09 PM
How to use MySQL's COUNT function to count the number of rows in a data table. In MySQL, the COUNT function is a very powerful function that is used to count the number of rows in a data table that meet specific conditions. This article will introduce how to use MySQL's COUNT function to count the number of rows in a data table, and provide relevant code examples. The syntax of the COUNT function is as follows: SELECTCOUNT(column_name)FROMtable_nameWHEREconditi
 How to use SQL statements for data aggregation and statistics in MySQL?
Dec 17, 2023 am 08:41 AM
How to use SQL statements for data aggregation and statistics in MySQL?
Dec 17, 2023 am 08:41 AM
How to use SQL statements for data aggregation and statistics in MySQL? Data aggregation and statistics are very important steps when performing data analysis and statistics. As a powerful relational database management system, MySQL provides a wealth of aggregation and statistical functions, which can easily perform data aggregation and statistical operations. This article will introduce the method of using SQL statements to perform data aggregation and statistics in MySQL, and provide specific code examples. 1. Use the COUNT function for counting. The COUNT function is the most commonly used
