

How to solve the problem of blurry images drawn on Canvas?
Canvas is a new tag of HTML5. It is a canvas that can draw graphics. The default size of the canvas is 300x150. There are issues to pay attention to when customizing the size of the drawing canvas, which is when using styles to set the height and width For example,
    <div style="width:1000px; height: 600px; " id="canvas_size">
        <canvas id="canvas" style="width: 100%; height: 100%; background-color: #eee">您的浏览器不支持H5画布属性</canvas>
    <script type="text/javascript">
        var canvas = document.getElementById("canvas");
        var ctx = canvas.getContext("2d");
        ctx.arc(120, 75, 20, 0, Math.PI * 2, false);
        ctx.fillStyle = "#000";
        ctx.fill();
    </script>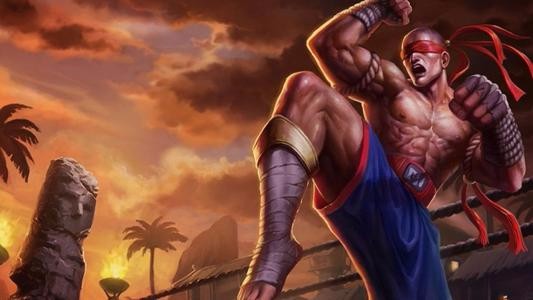
</div> is equivalent to stretching the entire canvas, and drawing like this The resulting graphics are blurry. 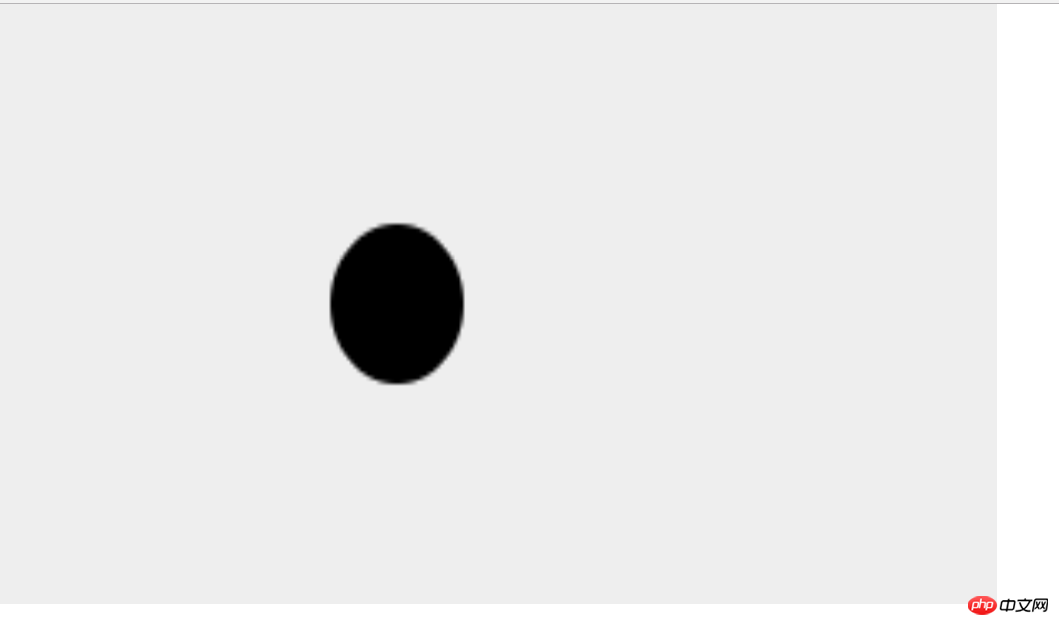
You can see that the edge of the circle is blurred and turned into an ellipse? This is because the canvas is still the default size of 300px wide and 150px high, but the canvas is forcibly stretched to 1000x600 using style. The width is expanded by 3.33 times and the height is expanded by 4 times, so it becomes an ellipse. Change the width to 1200 and it will be round.
So you cannot set the size in the style. You should use the width and height properties of the canvas to set the height. Look at the code below. Note that the parameters for drawing a circle have also changed
<div style="width:1000px; height: 600px; " id="canvas_size">
    <canvas id="canvas" width="1000px" height="600px" style="background-color: #eee">您的浏览器不支持H5画布属性</canvas>
    <script type="text/javascript">
        var canvas = document.getElementById("canvas");
        var ctx = canvas.getContext("2d");
        ctx.arc(500, 300, 200, 0, Math.PI * 2, false);
        ctx.fillStyle = "#000";
        ctx.fill();

    </script>
</div>
So to set the size of the canvas, use the width and height attributes that come with the canvas. It is the real size of the canvas. There are ways to solve it online, but I didn't try it because it seemed too troublesome. It would be better to just give it a fixed size in the future. Some people say how to customize it like this. It's easy. Just put a div and get the width in js or get the width and height of the screen and set the value of the canvas. code show as below.
<div style="width:1000px; height: 600px; " id="canvas_size"><canvas id="canvas" style="background-color: #eee">您的浏览器不支持H5画布属性</canvas> <script type="text/javascript">var canvas = document.getElementById("canvas");var canvas_size = document.getElementById("canvas_size");//获取divvar ctx = canvas.getContext("2d");canvas.width = canvas_size.offsetWidth;//设置宽canvas.height = canvas_size.offsetHeight;//设置高ctx.arc(500, 300, 200, 0, Math.PI * 2, false);ctx.fillStyle = "#000";ctx.fill();</script> </div>The result is the same as the picture above, you can try it yourself.
Summary
##The width and height of the canvas must be written using the built-in width and height to determine the true canvas size, <canvas width="1000px" height="600px" style="background-color: #eee">Your browser does not support H5 canvas attributes</canvas><span style="font-size: 16px;"></span> , adaptive use js to set.
The above is the detailed content of How to solve the problem of blurry images drawn on Canvas?. For more information, please follow other related articles on the PHP Chinese website!

Hot AI Tools

Undresser.AI Undress
AI-powered app for creating realistic nude photos

AI Clothes Remover
Online AI tool for removing clothes from photos.

Undress AI Tool
Undress images for free

Clothoff.io
AI clothes remover

Video Face Swap
Swap faces in any video effortlessly with our completely free AI face swap tool!

Hot Article
Hot Tools

Notepad++7.3.1
Easy-to-use and free code editor

SublimeText3 Chinese version
Chinese version, very easy to use

Zend Studio 13.0.1
Powerful PHP integrated development environment

Dreamweaver CS6
Visual web development tools

SublimeText3 Mac version
God-level code editing software (SublimeText3)
Hot Topics
 1655
1655
 14
1413
52
1306
25
1252
29
1226
24
14
1413
52
1306
25
1252
29
1226
24

 How to blur photos with Yitian camera
Feb 23, 2024 pm 06:40 PM
How to blur photos with Yitian camera
Feb 23, 2024 pm 06:40 PM
You can blur the photos in Yitian Camera, so how to blur the photos? Users can click Edit to select a photo, then click Effects and select Blur to blur the photo. This introduction to how to blur photos can tell you the specific content. The following is a detailed introduction, come and take a look! Yitian Camera usage tutorial. How to blur photos with Yitian Camera. Answer: Go to Edit-Special Effects-Blur. The specific process: 1. First open the app and click Edit on the lower left. 2. Then click on a picture and click the edit button. 3. Then click the special effects button below. 4. You can find the blur function below. 5. Then select the magnification of the blur.
 Can the floor plan be drawn directly in architectural ppt?
Mar 20, 2024 am 08:43 AM
Can the floor plan be drawn directly in architectural ppt?
Mar 20, 2024 am 08:43 AM
ppt is widely used in many fields and work, especially in education, architecture, etc. When it comes to architectural ppt, we must first think of the presentation of some architectural drawings. If we do not use professional drawing software, can we directly draw a simple architectural plan? In fact, we can complete the operation here. Below, we will draw a relatively simple floor plan to give you an idea. I hope you can complete better floor plan drawings based on this idea. 1. First, we double-click to open the ppt software on the desktop and click to create a new presentation blank document. 2. We find Insert→Shape→Rectangle in the menu bar. 3. After drawing the rectangle, double-click the graphic and modify the fill color type. Here we can modify
 How to solve the problem of blurry wallpaper in win11
Jan 02, 2024 pm 09:05 PM
How to solve the problem of blurry wallpaper in win11
Jan 02, 2024 pm 09:05 PM
Sometimes the wallpaper is blurred when using Win11. I don’t know what’s going on. In fact, we can solve it by modifying the registry or application compatibility. Win11 wallpaper blur solution: 1. Desktop blur 1. If the desktop is blurred, you can right-click the bottom start menu and open "Run" 2. Then enter "regedit" and press Enter to open the registry. 3. After opening, go to the "Computer\HKEY_CURRENT_USER\ControlPanel\Desktop" location. 4. After entering, right-click on the blank space and select Create a new "DWORD Value" 5. Rename it to "JPEGImportQuality" and double-click to open the data.
 Learn the canvas framework and explain the commonly used canvas framework in detail
Jan 17, 2024 am 11:03 AM
Learn the canvas framework and explain the commonly used canvas framework in detail
Jan 17, 2024 am 11:03 AM
Explore the Canvas framework: To understand what are the commonly used Canvas frameworks, specific code examples are required. Introduction: Canvas is a drawing API provided in HTML5, through which we can achieve rich graphics and animation effects. In order to improve the efficiency and convenience of drawing, many developers have developed different Canvas frameworks. This article will introduce some commonly used Canvas frameworks and provide specific code examples to help readers gain a deeper understanding of how to use these frameworks. 1. EaselJS framework Ea
 Learn to draw dendrograms and radar charts in Python in five minutes
Sep 27, 2023 pm 12:48 PM
Learn to draw dendrograms and radar charts in Python in five minutes
Sep 27, 2023 pm 12:48 PM
Learn to draw dendrograms and radar charts with Python in five minutes. In data visualization, dendrograms and radar charts are two commonly used chart forms. Treemaps are used to show hierarchical structures, while radar charts are used to compare data across multiple dimensions. This article will introduce how to draw these two charts using Python and provide specific code examples. 1. Drawing dendrograms There are multiple libraries in Python that can be used to draw dendrograms, such as matplotlib and graphviz. The following uses the matplotlib library as an example to demonstrate
 How to draw a 3D geographic chart with Python
Sep 28, 2023 am 10:19 AM
How to draw a 3D geographic chart with Python
Sep 28, 2023 am 10:19 AM
Overview of how to draw 3D geographic charts with Python: Drawing 3D geographic charts can help us understand geographic data and spatial distribution more intuitively. Python, as a powerful and easy-to-use programming language, provides many libraries and tools for drawing various types of geographical charts. In this article, we will learn how to draw 3D geographic charts using the Python programming language and some popular libraries such as Matplotlib and Basemap. Environment preparation: Before starting, we need to make sure
 uniapp implements how to use canvas to draw charts and animation effects
Oct 18, 2023 am 10:42 AM
uniapp implements how to use canvas to draw charts and animation effects
Oct 18, 2023 am 10:42 AM
How to use canvas to draw charts and animation effects in uniapp requires specific code examples 1. Introduction With the popularity of mobile devices, more and more applications need to display various charts and animation effects on the mobile terminal. As a cross-platform development framework based on Vue.js, uniapp provides the ability to use canvas to draw charts and animation effects. This article will introduce how uniapp uses canvas to achieve chart and animation effects, and give specific code examples. 2. canvas
 How to draw animated charts with Python
Sep 27, 2023 am 09:53 AM
How to draw animated charts with Python
Sep 27, 2023 am 09:53 AM
How to Draw Animated Charts with Python As a powerful programming language, Python can be used for various data visualization and chart drawing. Among them, drawing animated charts can make the data more vivid and interesting. This article will introduce how to use Python to draw animated charts and provide specific code examples. First, we need to install the matplotlib library, which is one of the most commonly used charting libraries in Python. Run the following command in the terminal to install matplotlib: pipinsta
