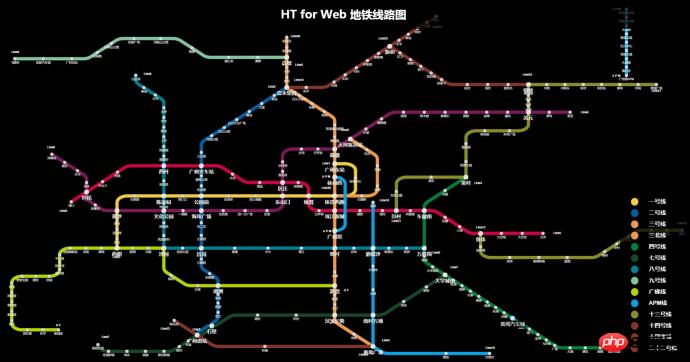
这篇文章给大家介绍的文章内容是关于基于 html5 canvas 的交互式地铁线路图,有很好的参考价值,希望可以帮助到有需要的朋友。
前言
前两天在 echarts 上寻找灵感的时候,看到了很多有关地图类似的例子,地图定位等等,但是好像就是没有地铁线路图,就自己花了一些时间捣鼓出来了这个交互式地铁线路图的 Demo,地铁线路上的点是在网上随便下载了一个,这篇文章记录自己的一些收获(毕竟我还是个菜鸟)以及代码的实现,希望能够帮到一些朋友。当然,如果有什么意见的可以直接跟我说,大家一起交流才会进步。
效果图

http://www.hightopo.com/demo/subway/index.html
立即学习“前端免费学习笔记(深入)”;
地图稍微内容有点多,要全部展示,字显得有点小了,但是没关系,可以按照需求放大缩小,字体和绘制的内容并不会失真,毕竟都是用矢量绘制的~
界面生成
底层的 div 是通过 ht.graph.GraphView 组件生成的,然后就可以利用 HT for Web 提供好的方法,调用 canvas 画笔随便绘制就好,先来看看怎么生成底层 div:
var dm = new ht.DataModel();//数据容器
var gv = new ht.graph.GraphView(dm);//拓扑组件
gv.addToDOM();//将拓扑图组件添加进body中
addToDOM 函数声明如下:
addToDOM = function(){
    var self = this,
        view = self.getView(),
        style = view.style;
    document.body.appendChild(view); //将组件底层div添加到body中
    style.left = '0';//默认组件是绝对定位,所以要设置位置
    style.right = '0';
    style.top = '0';
    style.bottom = '0';
    window.addEventListener('resize', function () { self.iv(); }, false); //窗口变化事件
}现在我就可以在这个 div 上乱涂乱画了~首先我获取下载好的地铁线路图上的点,我将它们放在 subway.js 中,这个 js 文件全部都是下载的内容,我没有做其他的改动,主要是将这些点根据线路来分分配添加到数组中,比如:
mark_Point13 = [];//线路 数组内包含线路的起点和终点坐标以及这条线路的名称
t_Point13 = [];//换成站点 数组内包含线路中的换乘站点坐标以及换成站点名称
n_Point13 = [];//小站点 数组内包含线路中的小站点坐标以及小站点名称
mark_Point13.push({ name: '十三号线', value: [113.4973,23.1095]});
mark_Point13.push({ name: '十三号线', value: [113.4155,23.1080]});
t_Point13.push({ name: '鱼珠', value: [113.41548,23.10547]});
n_Point13.push({ name: '裕丰围', value: [113.41548,23.10004]});接下来来描绘地铁线路,我声明了一个数组 lineNum,用来装 js 中所有的地铁线路的编号,以及一个 color 数组,用来装所有的地铁线的颜色,这些颜色的 index 与 lineNum 中地铁线编号的 index 是一一对应的:
var lineNum = ['1', '2', '3', '30', '4', '5', '6', '7', '8', '9', '13', '14', '32', '18', '21', '22', '60', '68'];
var color = ['#f1cd44', '#0060a1', '#ed9b4f', '#ed9b4f', '#007e3a', '#cb0447', '#7a1a57', '#18472c', '#008193', '#83c39e', '#8a8c29', '#82352b', '#82352b', '#09a1e0', '#8a8c29', '#82352b', '#b6d300', '#09a1e0'];
接着遍历 lineNum,将 lineNum 中的元素和颜色传到 createLine 函数中,根据这两个参数来绘制地铁线路以及配色,毕竟 js 文件中的命名方式也是有规律的,哪一条线路,则命名后面一定会加上对应的数字,所以我们只需要将字符串与这个编号结合即可获得 js 中对应的数组了:
let lineName = 'Line' + num;
let line = window[lineName];
createLine 的定义也非常简单,我的代码设置了不少的样式,所以看起来有点多。创建一个 ht.Polyline 管线,我们可以通过 polyline.addPoint() 函数向这个变量中添加具体的点,通过 setSegments 可以设置点的连接方式。
function createLine(num, color) {//绘制地图线
    var polyline = new ht.Polyline();//多边形 管线
    polyline.setTag(num);//设置节点tag标签,作为唯一标示

    if(num === '68') polyline.setToolTip('A P M');//设置提示信息
    else if(num === '60') polyline.setToolTip('G F');
    else polyline.setToolTip('Line' + num);
    if(color) {
        polyline.s({//s 为 setStyle 的简写,设置样式
            'shape.border.width': 0.4,//设置多边形的边框宽度
            'shape.border.color': color,//设置多边形的边框颜色
            'select.width': 0.2,//设置选中节点的边框宽度
            'select.color': color//设置选中节点的边框颜色
        });
    }
    let lineName = 'Line' + num;
    let line = window[lineName];
    for(let i = 0; i < line.length; i++) {
        for(let j = 0; j < line[i].coords.length; j++) {
            polyline.addPoint({x: line[i].coords[j][0]*300, y: -line[i].coords[j][1]*300});
            if(num === '68'){//APM线(有两条,但是点是在同一个数组中的)
                if(i === 0 && j === 0) {
                    polyline.setSegments([1]);
                }
                else if(i === 1 && j === 0) {
                    polyline.getSegments().push(1);
                }
                else {
                    polyline.getSegments().push(2);
                }
            }
        }
    }
    polyline.setLayer('0');//将线设置在下层,点设置在上层“top”
    dm.add(polyline);//将管线添加进数据容器中储存,不然这个管线属于“游离”状态,是不会显示在拓扑图上的
    return polyline;
}上面代码中添加地铁线上的点有分为几种情况,是因为 js 中设置线的时候 Line68 有一个“跳跃”点的现象,所以我们必须“跳跃”过去,篇幅有限 Line68 数组具体的声明自行看 subway.js。
这里说明一点,如果用的是 addPoint 函数,不设置 segments 时,默认将添加进的点用直线连接,segments 的定义如下:
1: moveTo,占用 1 个点信息,代表一个新路径的起点
2: lineTo,占用 1 个点信息,代表从上次最后点连接到该点
3: quadraticCurveTo,占用 2 个点信息,第一个点作为曲线控制点,第二个点作为曲线结束点
4: bezierCurveTo,占用 3 个点信息,第一和第二个点作为曲线控制点,第三个点作为曲线结束点
5: closePath,不占用点信息,代表本次路径绘制结束,并闭合到路径的起始点
所以我们要做“跳跃”的行为设置 segments 为 1 即可。
最后绘制这些地铁线上的点,这个部分 subway.js 中也分离出来了,命名以“mark_Point”、“t_Point”以及“n_Point”开头,我在前面 js 的展示部分有对这些数组进行解释,大家动动中指划上去看看。
我们在这些点的位置添加 ht.Node 节点,当节点一添加进 dm 数据容器中时,就会在拓扑图上显示,当然,前提是这个拓扑图组件 gv 设置的数据容器是这个 dm。篇幅有限,添加地铁线上的点的代码部分我只展示添加“换乘站点”的点:
var tName = 't_Point' + num;
var tP = window[tName];//大站点
if(tP) {//有些线路没有“换乘站点”
    for(let i = 0; i < tP.length; i++) {
        let node = createNode(tP[i].name, tP[i].value, color[index]);//在获取的线路上的点的坐标位置添加节点
        node.s({//设置节点的样式style
            'label.scale': 0.05,//文本缩放,可以避免浏览器限制的最小字号问题
            'label.font': 'bold 12px arial, sans-serif'//设置文本的font
        });
        node.setSize(0.6, 0.6);//设置节点大小。由于js中每个点之间的偏移量太小,所以我不得不把节点设置小一些
        node.setImage('images/旋转箭头.json');//设置节点的图片
        node.a('alarmColor1', 'rgb(150, 150, 150)');//attr属性,可以在这里面设置任何的东西,alarmColor1是在上面设置的image的json中绑定的属性,具体参看 HT for Web 矢量手册(http://www.hightopo.com/guide/guide/core/vector/ht-vector-guide.html#ref_binding)
        node.a('alarmColor2', 'rgb(150, 150, 150)');//同上
        node.a('tpNode', true);//这个属性设置只是为了用来区分“换乘站点”和“小站点”的,后面会用上
    }
}所有的地铁线路以及站点都添加完毕。但是!你可能会看不见自己绘制的图,因为他们太小了,这个时候可以设置 graphView 拓扑组件上的 fitContent 函数,我们顺便将拓扑图上的所有东西不可移动也设置一下:
gv.fitContent(false, 0.00001);//自适应大小,参数1为是否动画,参数2为gv与边框的padding值
gv.setMovableFunc(function(){
    return false;//设置gv上的节点不可移动
});这下你的地铁线路图就可以显示啦~接下来看看交互。
交互
首先是鼠标移动事件,鼠标滑过具体线路时,线路会变粗,悬停一会儿还能看到这条线路的编号;当鼠标移动到“换乘站点”或“小站点”,站点对应的图标都会变大并且变色,字体也会变大,鼠标移开图标变回原来的颜色并且字体变小。不同点在于鼠标移动到“换乘站点”时,“换乘站点”会旋转。
鼠标滑动事件,我直接基于 gv 的底层 div 进行的 mousemove 事件,通过 ht 封装的 getDataAt 函数传入事件 event 参数,获取事件下对应的节点,然后就可以随意操作节点了:
gv.getView().addEventListener('mousemove', function(e) {
    var data = gv.getDataAt(e);//传入逻辑坐标点或者交互event事件参数,返回当前点下的图元
    if(name) {
        originNode(name);//不管什么时候都要让节点保持原来的大小
    }
    if (data instanceof ht.Polyline) {//判断事件节点的类型
        dm.sm().ss(data);//选中“管道”
        name = '';
        clearInterval(interval);
    }
    else if (data instanceof ht.Node) {
        if(data.getTag() !== name && data.a('tpNode')) {//若不是同一个节点,并且mousemove的事件对象为ht.Node类型,那么设置节点的旋转
            interval = setInterval(function() {
                data.setRotation(data.getRotation() - Math.PI/16); //在自身旋转的基础上再旋转
            }, 100);
        }
        if(data.a('npNode')) {//如果鼠标移到“小站点”也要停止动画
            clearInterval(interval);
        }
        expandNode(data, name);////自定义的放大节点函数,比较容易,我不粘代码了,可以去http://hightopo.com/   查看
        dm.sm().ss(data);//设置选中节点
        name = data.getTag();//作为“上一个节点”的存储变量,可以通过这个值来获取节点
    }
    else {//其他任何情况则不选中任何内容并且清除“换乘站点”上的动画
        dm.sm().ss(null);
        name = '';
        clearInterval(interval);
    }
});鼠标悬停在地铁线路上时显示“具体线路信息”,我是通过设置 tooltip 来完成的(注意:要打开 gv 的 tooltip 开关):
gv.enableToolTip();//打开 tooltip 的开关
if(num === '68') polyline.setToolTip('A P M');//设置提示信息
else if(num === '60') polyline.setToolTip('G F');
else polyline.setToolTip('Line' + num);然后我利用右下角的 form 表单,单击表单上的具体线路,或者双击拓扑图上任意一个“站点”或者线路,则拓扑图会自适应到对应的部分,将被双击的部分展现到拓扑图的中央。
form 表单的声明部分我好像还没有解释。。。就是通过 new 一个 ht.widget.FomePane 类创建一个 form 表单组件,通过 form.getView() 获取表单组件的底层 div,将这个 div 摆放在 body 右下角,然后通过 addRow 函数向 form 表单中添加一行的表单项,可以在这行中添加任意多个项,通过 addRow 函数的第二个参数(一个数组),对添加进的表单项进行宽度的设置,通过第三个参数设置这行的高度:
function createForm() {//创建右下角的form表单
    var form = new ht.widget.FormPane();
    form.setWidth(200);//设置表单宽度
    form.setHeight(416);//设置表单高度
    let view = form.getView();
    document.body.appendChild(view);//将表单添加进body中
    view.style.zIndex = 1000;
    view.style.bottom = '10px';//ht组件几乎都设置绝对路径
    view.style.right = '10px';
    view.style.background = 'rgba(211, 211, 211, 0.8)';
    names.forEach(function(nameString) {
        form.addRow([//向表单中添加行
            {//这一行中的第一个表单项
                button: {//向表单中添加button按钮
                    icon: 'images/Line'+nameString.value+'.json',//设置按钮的图标
                    background: '',//设置按钮的背景
                    borderColor: '',//设置按钮的边框颜色
                    clickable: false//设置按钮不可点击
                }
            },
            {//第二个表单项
                button: {
                    label: nameString.name,
                    labelFont: 'bold 14px arial, sans-serif',
                    labelColor: '#fff',
                    background: '',
                    borderColor: '',
                    onClicked: function() {//按钮点击回调事件
                        gv.sm().ss(dm.getDataByTag(nameString.value));//设置选中按下的按钮对应的线路
                        gv.fitData(gv.sm().ld(), true, 5);//将选中的地铁线路显示在拓扑图的中央
                    }
                }
            }
        ], [0.1, 0.2], 23);//第二个参数是设置第一参数中的数组的宽度,小于1是比例,大于1是实际宽度。第三个参数是该行的高度
    });
}单击“站点”显示红色标注,双击节点自适应放置到拓扑图中央以及双击空白处将红色标注隐藏的内容都是通过对拓扑组件 gv 的事件监听来控制的,非常清晰易懂,代码如下:
var node = createRedLight();//创建一个新的节点,显示为“红灯”的样式
gv.mi(function(e) {//ht 中拓扑组件中的事件监听
    if(e.kind === 'clickData' && (e.data.a('tpNode') || e.data.a('npNode'))) {//e.kind获取当前事件类型,e.data获取当前事件下的节点
        node.s('2d.visible', true);//设置node节点可见
        node.setPosition(e.data.getPosition().x, e.data.getPosition().y);//设置node的坐标为当前事件下节点的位置
    }
    else if(e.kind === 'doubleClickData') {//双击节点
        gv.fitData(e.data, false, 10);//将事件下的节点自适应到拓扑图的中央,参数1为自适应的节点,参数2为是否动画,参数3为gv与边框的padding
    }
    else if(e.kind === 'doubleClickBackground') {//双击空白处
        node.s('2d.visible', false);//设置node节点不可见 查看 HT for Web 样式手册(http://www.hightopo.com/guide/guide/core/theme/ht-theme-guide.html#ref_style)
    }
});注意 s(style) 和 a(attr) 定义是这样的,s 是 ht 预定义的一些样式属性,而 a 是我们用户来自定义的属性,一般是通过调用字符串来调用结果的,这个字符串对应的可以是常量也可以是函数,还是很灵活的。
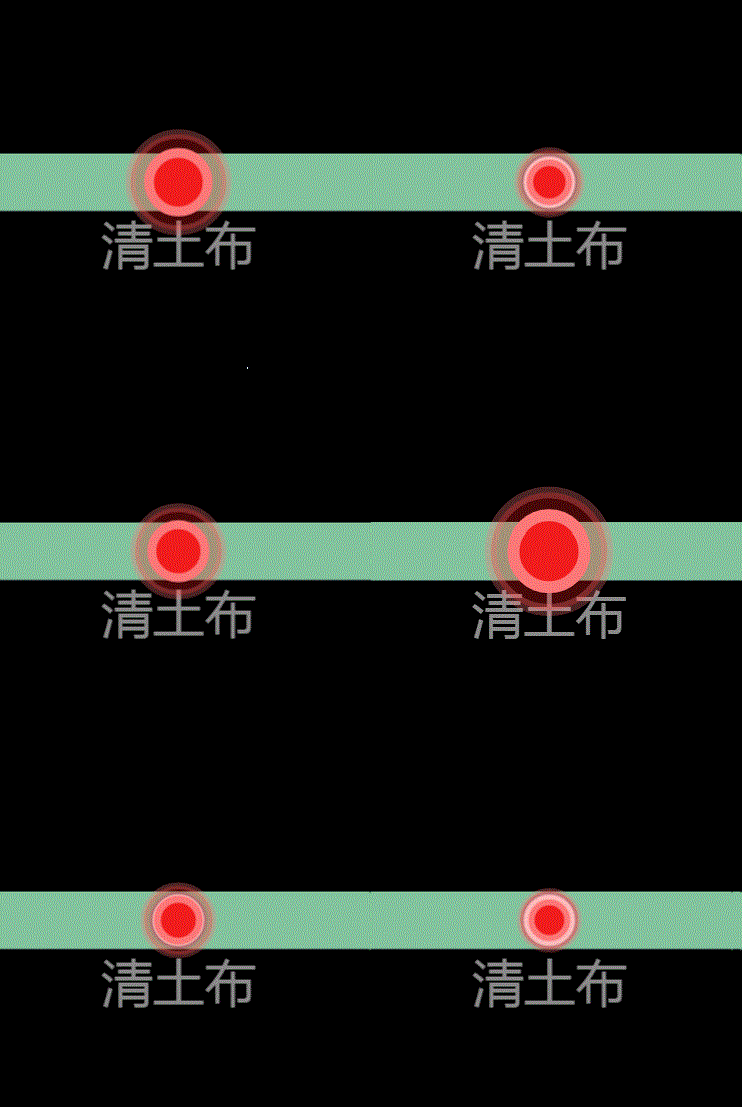
最后还做了一个小小的部分,选中“站点”,则该“站点”的上方会显示一个红色的会“呼吸”的用来注明当前选中的“站点”。

“呼吸”的部分是利用 ht 的 setAnimation 函数来完成的,在用这个函数之前要先打开数据容器的动画开关,然后设置动画:
dm.enableAnimation();//打开数据容器的动画开关
function createRedLight() {
    var node = new ht.Node();
    node.setImage('images/红灯.json');//设置节点的图片
    node.setSize(1, 1);//设置节点的大小
    node.setLayer('firstTop');//设置节点显示在gv的最上层
    node.s('2d.visible', false);//节点不可见
    node.s('select.width', 0);//节点选中时的边框为0,不可见
    node.s('2d.selectable', false);//设置这个属性,则节点不可选中
    node.setAnimation({//设置动画 具体参见 HT for Web 动画手册(http://www.hightopo.com/guide/guide/plugin/animation/ht-animation-guide.html)
        expandWidth: {
            property: "width",//设置这个属性,并且未设置 accessType,则默认通过 setWidth/getWidth 来设置和获取属性。这里的 width 和下面的 height 都是通过前面设置的 size 得到的
            from: 0.5, //动画开始时的属性值
            to: 1,//动画结束时的属性值
            next: "collapseWidth"//字符串类型,指定当前动画完成之后,要执行的下个动画,可将多个动画融合
        },
        collapseWidth: {
            property: "width",
            from: 1,
            to: 0.5,
            next: "expandWidth"
        },
        expandHeight: {
            property: "height",
            from: 0.5,
            to: 1,
            next: "collapseHeight"
        },
        collapseHeight: {
            property: "height",
            from: 1,
            to: 0.5,
            next: "expandHeight"
        },
        start: ["expandWidth", "expandHeight"]//数组,用于指定要启动的一个或多个动画
    });
    dm.add(node);
    return node;
}全部代码结束!
总结
这个 Demo 花了我两天时间完成,总觉得有点不甘心啊,但是有时候思维又转不过弯来,花费了不少的时间,但是总的来说收获还是很多的,我以前一直以为只要通过 getPoints().push 来向多边形中添加点就可以了,求助了大神之后,发现原来这个方法不仅绕弯路而且还会出现各种各样的问题,比如 getPoints 之前,一定要在多边形中已经有 points 才可以,但是在很多情况下,初始化的 points 并不好设置,而且会造成代码很繁琐,直接通过 addPoint 方法,直接将点添加进多边形变量中,并且还会默认将点通过直线的方式连接,也不用设置 segments,多可爱的一个函数。
还有就是因为 ht 默认缩放大小是 20,而我这个 Demo 的间距又很小,导致缩放到最大地铁线路图显示也很小,所以我在 htconfig 中更改了 ht 的默认 zoomMax 属性,记住,更改这个值一定要在所有的 ht 调用之前,因为在 htconfig 中设置的值在后面定义都是不可更改的。
相关推荐:
以上就是HTML5 Canvas实现交互式地铁线路图的详细内容,更多请关注php中文网其它相关文章!

HTML怎么学习?HTML怎么入门?HTML在哪学?HTML怎么学才快?不用担心,这里为大家提供了HTML速学教程(入门课程),有需要的小伙伴保存下载就能学习啦!

Copyright 2014-2025 https://www.php.cn/ All Rights Reserved | php.cn | 湘ICP备2023035733号