

python3+PyQt5實現長條圖

這篇文章主要為大家詳細介紹了python3 PyQt5實現柱狀圖的方法,具有一定的參考價值,感興趣的小伙伴們可以參考一下
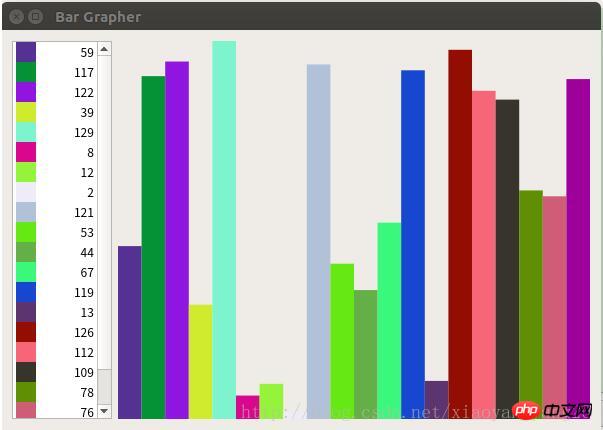
本文透過Python3 pyqt5實現了python Qt GUI快速編程的16章的excise範例。
#!/usr/bin/env python3

import random
import sys
from PyQt5.QtCore import (QAbstractListModel, QAbstractTableModel,
  QModelIndex, QSize, QTimer, QVariant, Qt,pyqtSignal)
from PyQt5.QtWidgets import (QApplication, QDialog, QHBoxLayout,
  QListView, QSpinBox, QStyledItemDelegate,QStyleOptionViewItem, QWidget)
from PyQt5.QtGui import QColor,QPainter,QPixmap

class BarGraphModel(QAbstractListModel):
 dataChanged=pyqtSignal(QModelIndex,QModelIndex)
 def __init__(self):
  super(BarGraphModel, self).__init__()
  self.__data = []
  self.__colors = {}
  self.minValue = 0
  self.maxValue = 0


 def rowCount(self, index=QModelIndex()):
  return len(self.__data)


 def insertRows(self, row, count):
  extra = row + count
  if extra >= len(self.__data):
   self.beginInsertRows(QModelIndex(), row, row + count - 1)
   self.__data.extend([0] * (extra - len(self.__data) + 1))
   self.endInsertRows()
   return True
  return False


 def flags(self, index):
  #return (QAbstractTableModel.flags(self, index)|Qt.ItemIsEditable)
  return (QAbstractListModel.flags(self, index)|Qt.ItemIsEditable)

 def setData(self, index, value, role=Qt.DisplayRole):
  row = index.row()
  if not index.isValid() or 0 > row >= len(self.__data):
   return False
  changed = False
  if role == Qt.DisplayRole:
   value = value
   self.__data[row] = value
   if self.minValue > value:
    self.minValue = value
   if self.maxValue < value:
    self.maxValue = value
   changed = True
  elif role == Qt.UserRole:
   self.__colors[row] = value
   #self.emit(SIGNAL("dataChanged(QModelIndex,QModelIndex)"),
   #   index, index)
   self.dataChanged[QModelIndex,QModelIndex].emit(index, index)
   changed = True
  if changed:
   #self.emit(SIGNAL("dataChanged(QModelIndex,QModelIndex)"),
    #   index, index)
   self.dataChanged[QModelIndex,QModelIndex].emit(index, index)
  return changed


 def data(self, index, role=Qt.DisplayRole):
  row = index.row()
  if not index.isValid() or 0 > row >= len(self.__data):
   return QVariant()
  if role == Qt.DisplayRole:
   return self.__data[row]
  if role == Qt.UserRole:
   return QVariant(self.__colors.get(row,
     QColor(Qt.red)))
  if role == Qt.DecorationRole:
   color = QColor(self.__colors.get(row,
     QColor(Qt.red)))
   pixmap = QPixmap(20, 20)
   pixmap.fill(color)
   return QVariant(pixmap)
  return QVariant()


class BarGraphDelegate(QStyledItemDelegate):

 def __init__(self, minimum=0, maximum=100, parent=None):
  super(BarGraphDelegate, self).__init__(parent)
  self.minimum = minimum
  self.maximum = maximum


 def paint(self, painter, option, index):
  myoption = QStyleOptionViewItem(option)
  myoption.displayAlignment |= (Qt.AlignRight|Qt.AlignVCenter)
  QStyledItemDelegate.paint(self, painter, myoption, index)


 def createEditor(self, parent, option, index):
  spinbox = QSpinBox(parent)
  spinbox.setRange(self.minimum, self.maximum)
  spinbox.setAlignment(Qt.AlignRight|Qt.AlignVCenter)
  return spinbox


 def setEditorData(self, editor, index):
  value = index.model().data(index, Qt.DisplayRole)
  editor.setValue(value)


 def setModelData(self, editor, model, index):
  editor.interpretText()
  model.setData(index, editor.value())


class BarGraphView(QWidget):

 WIDTH = 20

 def __init__(self, parent=None):
  super(BarGraphView, self).__init__(parent)
  self.model = None


 def setModel(self, model):
  self.model = model
  #self.connect(self.model,
  #  SIGNAL("dataChanged(QModelIndex,QModelIndex)"),
  #  self.update)
  self.model.dataChanged[QModelIndex,QModelIndex].connect(self.update)
  #self.connect(self.model, SIGNAL("modelReset()"), self.update)
  self.model.modelReset.connect(self.update)


 def sizeHint(self):
  return self.minimumSizeHint()


 def minimumSizeHint(self):
  if self.model is None:
   return QSize(BarGraphView.WIDTH * 10, 100)
  return QSize(BarGraphView.WIDTH * self.model.rowCount(), 100)


 def paintEvent(self, event):
  if self.model is None:
   return
  painter = QPainter(self)
  painter.setRenderHint(QPainter.Antialiasing)
  span = self.model.maxValue - self.model.minValue
  painter.setWindow(0, 0, BarGraphView.WIDTH * self.model.rowCount(),
       span)
  for row in range(self.model.rowCount()):
   x = row * BarGraphView.WIDTH
   index = self.model.index(row)
   color = QColor(self.model.data(index, Qt.UserRole))
   y = self.model.data(index)
   painter.fillRect(x, span - y, BarGraphView.WIDTH, y, color)


class MainForm(QDialog):

 def __init__(self, parent=None):
  super(MainForm, self).__init__(parent)

  self.model = BarGraphModel()
  self.barGraphView = BarGraphView()
  self.barGraphView.setModel(self.model)
  self.listView = QListView()
  self.listView.setModel(self.model)
  self.listView.setItemDelegate(BarGraphDelegate(0, 1000, self))
  self.listView.setMaximumWidth(100)
  self.listView.setEditTriggers(QListView.DoubleClicked|
          QListView.EditKeyPressed)
  layout = QHBoxLayout()
  layout.addWidget(self.listView)
  layout.addWidget(self.barGraphView, 1)
  self.setLayout(layout)

  self.setWindowTitle("Bar Grapher")
  QTimer.singleShot(0, self.initialLoad)


 def initialLoad(self):
  # Generate fake data
  count = 20
  self.model.insertRows(0, count - 1)
  for row in range(count):
   value = random.randint(1, 150)
   color = QColor(random.randint(0, 255), random.randint(0, 255),
       random.randint(0, 255))
   index = self.model.index(row)
   self.model.setData(index, value)
   self.model.setData(index, QVariant(color), Qt.UserRole)


app = QApplication(sys.argv)
form = MainForm()
form.resize(600, 400)
form.show()
app.exec_()運行結果:
相關推薦:
#
以上是python3+PyQt5實現長條圖的詳細內容。更多資訊請關注PHP中文網其他相關文章!

熱AI工具

Undresser.AI Undress
人工智慧驅動的應用程序,用於創建逼真的裸體照片

AI Clothes Remover
用於從照片中去除衣服的線上人工智慧工具。

Undress AI Tool
免費脫衣圖片

Clothoff.io
AI脫衣器

Video Face Swap
使用我們完全免費的人工智慧換臉工具,輕鬆在任何影片中換臉!

熱門文章
熱工具

記事本++7.3.1
好用且免費的程式碼編輯器

SublimeText3漢化版
中文版,非常好用

禪工作室 13.0.1
強大的PHP整合開發環境

Dreamweaver CS6
視覺化網頁開發工具

SublimeText3 Mac版
神級程式碼編輯軟體(SublimeText3)


 PHP和Python:解釋了不同的範例
Apr 18, 2025 am 12:26 AM
PHP和Python:解釋了不同的範例
Apr 18, 2025 am 12:26 AM
PHP主要是過程式編程,但也支持面向對象編程(OOP);Python支持多種範式,包括OOP、函數式和過程式編程。 PHP適合web開發,Python適用於多種應用,如數據分析和機器學習。
 在PHP和Python之間進行選擇:指南
Apr 18, 2025 am 12:24 AM
在PHP和Python之間進行選擇:指南
Apr 18, 2025 am 12:24 AM
PHP適合網頁開發和快速原型開發,Python適用於數據科學和機器學習。 1.PHP用於動態網頁開發,語法簡單,適合快速開發。 2.Python語法簡潔,適用於多領域,庫生態系統強大。
 PHP和Python:深入了解他們的歷史
Apr 18, 2025 am 12:25 AM
PHP和Python:深入了解他們的歷史
Apr 18, 2025 am 12:25 AM
PHP起源於1994年,由RasmusLerdorf開發,最初用於跟踪網站訪問者,逐漸演變為服務器端腳本語言,廣泛應用於網頁開發。 Python由GuidovanRossum於1980年代末開發,1991年首次發布,強調代碼可讀性和簡潔性,適用於科學計算、數據分析等領域。
 Golang vs. Python:性能和可伸縮性
Apr 19, 2025 am 12:18 AM
Golang vs. Python:性能和可伸縮性
Apr 19, 2025 am 12:18 AM
Golang在性能和可擴展性方面優於Python。 1)Golang的編譯型特性和高效並發模型使其在高並發場景下表現出色。 2)Python作為解釋型語言,執行速度較慢,但通過工具如Cython可優化性能。
 Golang vs. Python:主要差異和相似之處
Apr 17, 2025 am 12:15 AM
Golang vs. Python:主要差異和相似之處
Apr 17, 2025 am 12:15 AM
Golang和Python各有优势:Golang适合高性能和并发编程,Python适用于数据科学和Web开发。Golang以其并发模型和高效性能著称,Python则以简洁语法和丰富库生态系统著称。
 Python與C:學習曲線和易用性
Apr 19, 2025 am 12:20 AM
Python與C:學習曲線和易用性
Apr 19, 2025 am 12:20 AM
Python更易學且易用,C 則更強大但複雜。 1.Python語法簡潔,適合初學者,動態類型和自動內存管理使其易用,但可能導致運行時錯誤。 2.C 提供低級控制和高級特性,適合高性能應用,但學習門檻高,需手動管理內存和類型安全。
 Python vs.C:探索性能和效率
Apr 18, 2025 am 12:20 AM
Python vs.C:探索性能和效率
Apr 18, 2025 am 12:20 AM
Python在開發效率上優於C ,但C 在執行性能上更高。 1.Python的簡潔語法和豐富庫提高開發效率。 2.C 的編譯型特性和硬件控制提升執行性能。選擇時需根據項目需求權衡開發速度與執行效率。
 Python vs. JavaScript:開發環境和工具
Apr 26, 2025 am 12:09 AM
Python vs. JavaScript:開發環境和工具
Apr 26, 2025 am 12:09 AM
Python和JavaScript在開發環境上的選擇都很重要。 1)Python的開發環境包括PyCharm、JupyterNotebook和Anaconda,適合數據科學和快速原型開發。 2)JavaScript的開發環境包括Node.js、VSCode和Webpack,適用於前端和後端開發。根據項目需求選擇合適的工具可以提高開發效率和項目成功率。
