

簡單的DIY心率監測心電圖顯示

Goal
The goal of this miniproject/tutorial is to make a super simple HR monitor and scrolling ECG display with minimal components.
Requirements:
- python
- audio interface
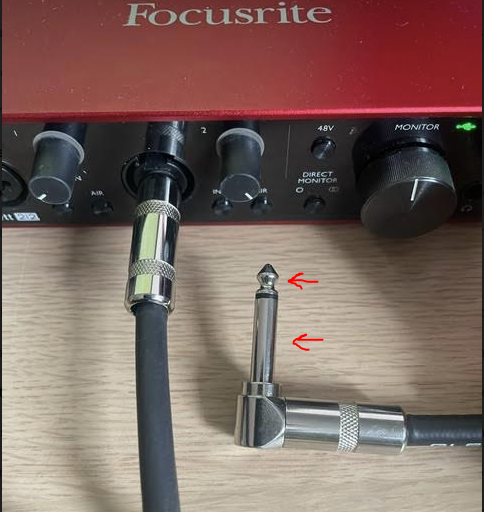
- 1/4" cable/guitar cable/instrument cable (it just needs to get into the computer via the audio interface)
Quick Background
The muscles in the heart create electrical signals. Some of those signals are detectable on the surface of the skin.
We can pick those signals up using surface electrodes. The problem is, these aren't the only electrical signals on the skin. Thankfully, most of the signals we want to see are confined to around 1-40Hz.
Process
We are going to take our 1/4" cable, which will act as our electrode and poke it into our skin in the vicinity of the heart. Then we use the USB audio interface to amplify and convert the analogue signal to digital. Finally we filter and display in python.
Steps
Step 1: A 1/4" cable has two parts, the sleeve and the tip. Both parts need to make contact with your skin- just hold the sleeve with your hand and mash it against the left side of your chest/upper rib cage (some cables may have more channels, just make sure they all have contact to start). Adjust gain on audio interface (I turn mine all the way up).
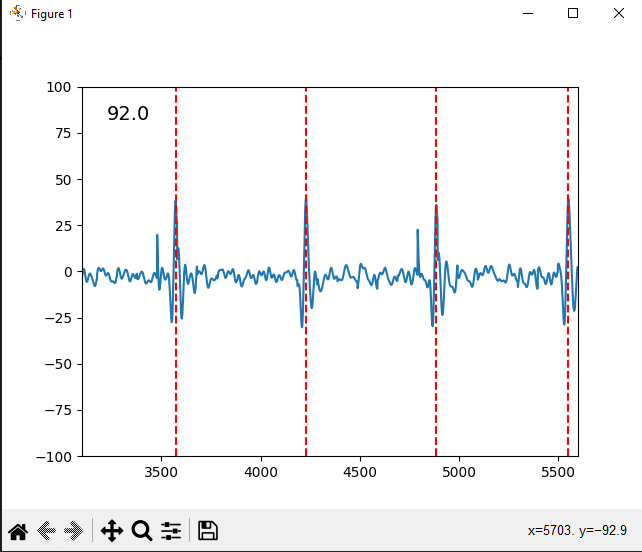
Step 2: Run the below code. Make sure to check that the input_device_index line is pointing to your audio interface. What we are doing is taking chunks of the incoming audio, converting to the frequency domain using fft, setting all unnecessary frequencies to 0, and then converting back to the time domain. Next we find the peaks to calculate the HR then graph in a way that scrolls.
import numpy as np
import pyaudio as pa
import struct
import matplotlib.pyplot as plt
from scipy.signal import decimate, find_peaks

CHUNK = 4410 #.1 second
FORMAT = pa.paInt16
CHANNELS = 1
RATE = 44100 # in Hz
fstep = RATE/CHUNK
p = pa.PyAudio()

values = []
dsf=44 #down sample factor
rds=RATE/dsf #down sampled rate

stream = p.open(
    format = FORMAT,
    channels = CHANNELS,
    rate = RATE,
    input_device_index=3, #adjust based on input
    input=True,
    frames_per_buffer=CHUNK
)

#set up graph
fig,ax = plt.subplots(1)
x = np.arange(0,2*CHUNK,2)
line, = ax.plot(x, np.random.rand(CHUNK))
ax.set_ylim(-100,100)
ax.set_xlim(0,2500)
text = ax.text(0.05, 0.95, str(0), transform=ax.transAxes, fontsize=14,
       verticalalignment='top')
fig.show()

def getFiltered(x,hp=1,lp=41): #this sets the unneeded freqs to 0

    fft=np.fft.fft(x)
    hptrim=len(fft)/RATE*hp
    lptrim=len(fft)/RATE*lp
    fft[int(lptrim):-int(lptrim)]=0
    fft[0:int(hptrim)]=0
    return np.real(np.fft.ifft(fft))

def getHR(x):

    pdis = int(0.6 * rds) #minimum distance between peaks. stops rapid triggering. also caps max hr, so adjust
    peaks, _ = find_peaks(x, distance=pdis, height=0.1)
    intervals = np.diff(peaks)/rds # in seconds
    hr = 60 / intervals # in BPM
    return peaks,round(np.mean(hr),0) #peaks,avg hr

while 1:
    data = stream.read(CHUNK)
    dataInt = struct.unpack(str(CHUNK) + 'h', data)

    filtered=getFiltered(dataInt) #filter (working with full chunk)
    dsed=decimate(filtered, 44) #down sample (turns chunk into ds chunk)
    values=np.concatenate((values,dsed)) #puts the chunks into an array
    peaks,hr = getHR(values*-1) # gets the peaks and determins avg HR.

    text.set_text(str(hr))
    line.set_xdata(np.arange(len(values)))
    line.set_ydata(values*-10) #the negative is bc it comes in upside down with my set up. the *10 is just for fun
    ax.set_xlim(max(0,len(values)-2500),len(values)) #keep the graph scrolling
    vlines = ax.vlines(peaks,ymin=-100,ymax=100,colors='red', linestyles='dashed') # pop some lines at the peaks

    fig.canvas.draw()
    fig.canvas.flush_events()
    vlines.remove()

    if len(values)>10000: #keeps the array managably sized, and graph scrolling pretty
        values=values[5000:] #5 seconds @ ~1000 sr.
Notes
Hold the cable still - you may need to wait a few seconds after movement to get an accurate heart rate. I checked it against my garmin watch, and it consistently returned similar values.
Output
Disclaimer
Keep in mind, you are technically making your body a part of the circuit. The cable is connected to the interface which is connected to the computer which is connected to the wall power outlet... Try this at your own risk. I am no expert- I just enjoy playing around with stuff, and wanted to share.
Next Steps
This method doesn't really work very well for cleanly seeing all of the different parts of an ECG signal. The electrode is super scuffed and I did a bare minimum of filtering.
It also doesn't do well in detecting smaller signals like for EMG.
From here you can dig deeper on the software side and play around with additional filters, or create an actual circuit and use real electrodes. A bag of electrodes for this type of thing is pretty cheap on amazon (heads up, the adhesive is annoying). For a circuit, I've tried a few different configurations- what I found simplest/worked the best for me was a simple instrumentation amplifier circuit using a JFET opamp (put together on a on a breadboard). 3 electrodes, just look up a diagram for where to put them. If you use the audio interface for the ADC, the code here should work with the 3 electrode breadboard set up (might have to adjust the gain)
Why
The inspiration for this miniproject came about while playing around with a EQ plug-in in a DAW while holding a guitar cable.
以上是簡單的DIY心率監測心電圖顯示的詳細內容。更多資訊請關注PHP中文網其他相關文章!

熱AI工具

Undresser.AI Undress
人工智慧驅動的應用程序,用於創建逼真的裸體照片

AI Clothes Remover
用於從照片中去除衣服的線上人工智慧工具。

Undress AI Tool
免費脫衣圖片

Clothoff.io
AI脫衣器

Video Face Swap
使用我們完全免費的人工智慧換臉工具,輕鬆在任何影片中換臉!

熱門文章
熱工具

記事本++7.3.1
好用且免費的程式碼編輯器

SublimeText3漢化版
中文版,非常好用

禪工作室 13.0.1
強大的PHP整合開發環境

Dreamweaver CS6
視覺化網頁開發工具

SublimeText3 Mac版
神級程式碼編輯軟體(SublimeText3)


 Python與C:學習曲線和易用性
Apr 19, 2025 am 12:20 AM
Python與C:學習曲線和易用性
Apr 19, 2025 am 12:20 AM
Python更易學且易用,C 則更強大但複雜。 1.Python語法簡潔,適合初學者,動態類型和自動內存管理使其易用,但可能導致運行時錯誤。 2.C 提供低級控制和高級特性,適合高性能應用,但學習門檻高,需手動管理內存和類型安全。
 學習Python:2小時的每日學習是否足夠?
Apr 18, 2025 am 12:22 AM
學習Python:2小時的每日學習是否足夠?
Apr 18, 2025 am 12:22 AM
每天學習Python兩個小時是否足夠?這取決於你的目標和學習方法。 1)制定清晰的學習計劃,2)選擇合適的學習資源和方法,3)動手實踐和復習鞏固,可以在這段時間內逐步掌握Python的基本知識和高級功能。
 Python vs.C:探索性能和效率
Apr 18, 2025 am 12:20 AM
Python vs.C:探索性能和效率
Apr 18, 2025 am 12:20 AM
Python在開發效率上優於C ,但C 在執行性能上更高。 1.Python的簡潔語法和豐富庫提高開發效率。 2.C 的編譯型特性和硬件控制提升執行性能。選擇時需根據項目需求權衡開發速度與執行效率。
 Python vs. C:了解關鍵差異
Apr 21, 2025 am 12:18 AM
Python vs. C:了解關鍵差異
Apr 21, 2025 am 12:18 AM
Python和C 各有優勢,選擇應基於項目需求。 1)Python適合快速開發和數據處理,因其簡潔語法和動態類型。 2)C 適用於高性能和系統編程,因其靜態類型和手動內存管理。
 Python標準庫的哪一部分是:列表或數組?
Apr 27, 2025 am 12:03 AM
Python標準庫的哪一部分是:列表或數組?
Apr 27, 2025 am 12:03 AM
pythonlistsarepartofthestAndArdLibrary,herilearRaysarenot.listsarebuilt-In,多功能,和Rused ForStoringCollections,而EasaraySaraySaraySaraysaraySaraySaraysaraySaraysarrayModuleandleandleandlesscommonlyusedDduetolimitedFunctionalityFunctionalityFunctionality。
 Python:自動化,腳本和任務管理
Apr 16, 2025 am 12:14 AM
Python:自動化,腳本和任務管理
Apr 16, 2025 am 12:14 AM
Python在自動化、腳本編寫和任務管理中表現出色。 1)自動化:通過標準庫如os、shutil實現文件備份。 2)腳本編寫:使用psutil庫監控系統資源。 3)任務管理:利用schedule庫調度任務。 Python的易用性和豐富庫支持使其在這些領域中成為首選工具。
 科學計算的Python:詳細的外觀
Apr 19, 2025 am 12:15 AM
科學計算的Python:詳細的外觀
Apr 19, 2025 am 12:15 AM
Python在科學計算中的應用包括數據分析、機器學習、數值模擬和可視化。 1.Numpy提供高效的多維數組和數學函數。 2.SciPy擴展Numpy功能,提供優化和線性代數工具。 3.Pandas用於數據處理和分析。 4.Matplotlib用於生成各種圖表和可視化結果。
 Web開發的Python:關鍵應用程序
Apr 18, 2025 am 12:20 AM
Web開發的Python:關鍵應用程序
Apr 18, 2025 am 12:20 AM
Python在Web開發中的關鍵應用包括使用Django和Flask框架、API開發、數據分析與可視化、機器學習與AI、以及性能優化。 1.Django和Flask框架:Django適合快速開發複雜應用,Flask適用於小型或高度自定義項目。 2.API開發:使用Flask或DjangoRESTFramework構建RESTfulAPI。 3.數據分析與可視化:利用Python處理數據並通過Web界面展示。 4.機器學習與AI:Python用於構建智能Web應用。 5.性能優化:通過異步編程、緩存和代碼優
