
seaborn.heatmap(data, vmin=None, vmax=None,cmap=None, center=None, robust=False, annot=None, fmt=’.2g’, annot_kws=None,linewidths=0, linecolor=’white’, cbar=True, cbar_kws=None, cbar_ax=None,square=False, xticklabels=’auto’, yticklabels=’auto’, mask=None, ax=None,**kwargs)
data:矩阵数据集,可以是numpy的数组(array),也可以是pandas的DataFrame。如果是DataFrame,则df的index/column信息会分别对应到heatmap的columns和rows,即pt.index是热力图的行标,pt.columns是热力图的列标
vmax,vmin:分别是热力图的颜色取值最大和最小范围,默认是根据data数据表里的取值确定
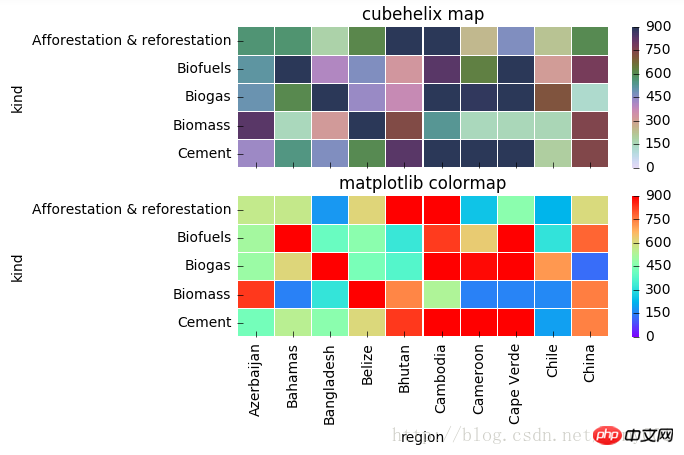
cmap:从数字到色彩空间的映射,取值是matplotlib包里的colormap名称或颜色对象,或者表示颜色的列表;改参数默认值:根据center参数设定
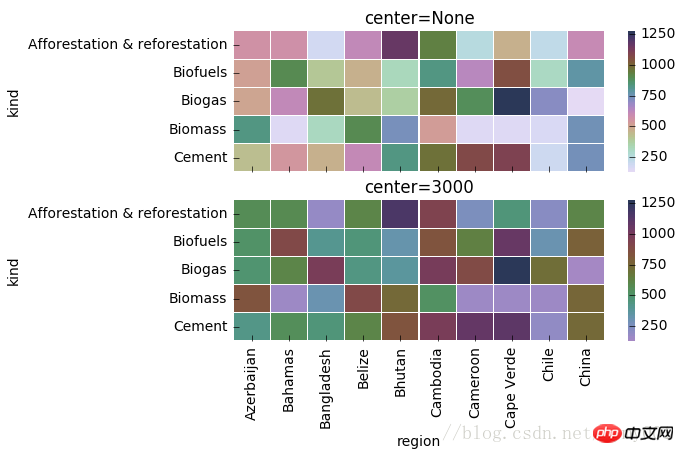
center:数据表取值有差异时,设置热力图的色彩中心对齐值;通过设置center值,可以调整生成的图像颜色的整体深浅;设置center数据时,如果有数据溢出,则手动设置的vmax、vmin会自动改变
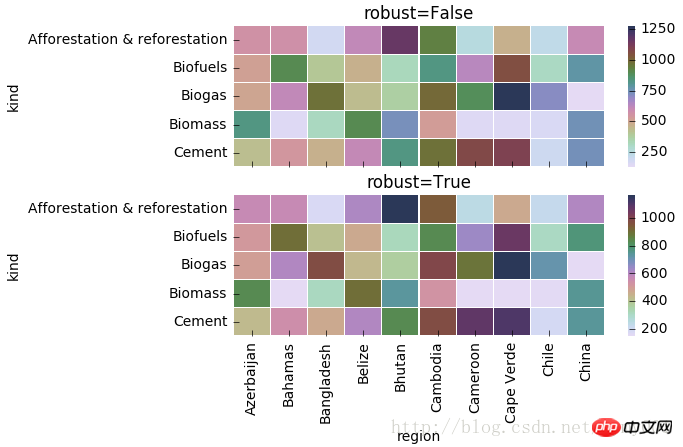
robust:默认取值False;如果是False,且没设定vmin和vmax的值,热力图的颜色映射范围根据具有鲁棒性的分位数设定,而不是用极值设定
annot(annotate的缩写):默认取值False;如果是True,在热力图每个方格写入数据;如果是矩阵,在热力图每个方格写入该矩阵对应位置数据
fmt:字符串格式代码,矩阵上标识数字的数据格式,比如保留小数点后几位数字
annot_kws:默认取值False;如果是True,设置热力图矩阵上数字的大小颜色字体,matplotlib包text类下的字体设置;官方文档:
linewidths:定义热力图里“表示两两特征关系的矩阵小块”之间的间隔大小
linecolor:切分热力图上每个矩阵小块的线的颜色,默认值是’white’
cbar:是否在热力图侧边绘制颜色刻度条,默认值是True
cbar_kws:热力图侧边绘制颜色刻度条时,相关字体设置,默认值是None
cbar_ax:热力图侧边绘制颜色刻度条时,刻度条位置设置,默认值是None
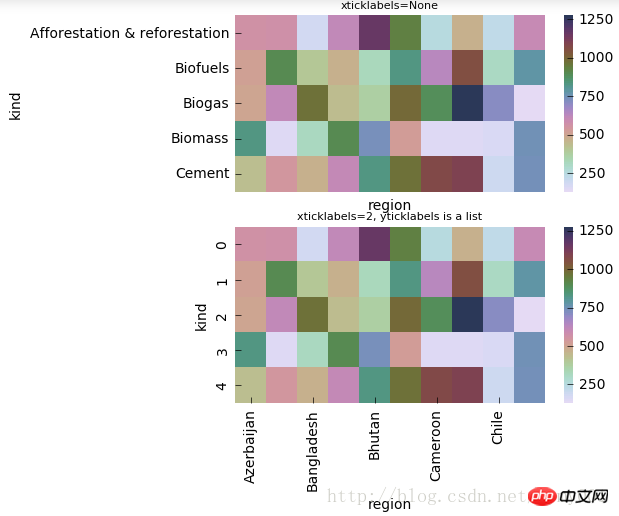
xticklabels, yticklabels:xticklabels控制每列标签名的输出;yticklabels控制每行标签名的输出。默认值是auto。如果是True,则以DataFrame的列名作为标签名。如果是False,则不添加行标签名。如果是列表,则标签名改为列表中给的内容。如果是整数K,则在图上每隔K个标签进行一次标注。 如果是auto,则自动选择标签的标注间距,将标签名不重叠的部分(或全部)输出
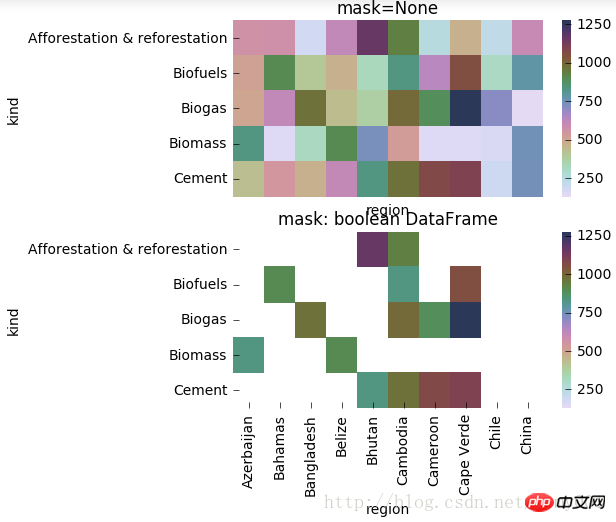
mask:控制某个矩阵块是否显示出来。默认值是None。如果是布尔型的DataFrame,则将DataFrame里True的位置用白色覆盖掉
ax:设置作图的坐标轴,一般画多个子图时需要修改不同的子图的该值
**kwargs:All other keyword arguments are passed to ax.pcolormesh
#cmap(颜色)

import matplotlib.pyplot as plt
% matplotlib inline

f, (ax1,ax2) = plt.subplots(figsize = (6,4),nrows=2)

# cmap用cubehelix map颜色
cmap = sns.cubehelix_palette(start = 1.5, rot = 3, gamma=0.8, as_cmap = True)
sns.heatmap(pt, linewidths = 0.05, ax = ax1, vmax=900, vmin=0, cmap=cmap)
ax1.set_title('cubehelix map')
ax1.set_xlabel('')
ax1.set_xticklabels([]) #设置x轴图例为空值
ax1.set_ylabel('kind')

# cmap用matplotlib colormap
sns.heatmap(pt, linewidths = 0.05, ax = ax2, vmax=900, vmin=0, cmap='rainbow')
# rainbow为 matplotlib 的colormap名称
ax2.set_title('matplotlib colormap')
ax2.set_xlabel('region')
ax2.set_ylabel('kind')
#center的用法(颜色)f, (ax1,ax2) = plt.subplots(figsize = (6, 4),nrows=2)

cmap = sns.cubehelix_palette(start = 1.5, rot = 3, gamma=0.8, as_cmap = True)
sns.heatmap(pt, linewidths = 0.05, ax = ax1, cmap=cmap, center=None )
ax1.set_title('center=None')
ax1.set_xlabel('')
ax1.set_xticklabels([]) #设置x轴图例为空值ax1.set_ylabel('kind')# 当center设置小于数据的均值时,生成的图片颜色要向0值代表的颜色一段偏移sns.heatmap(pt, linewidths = 0.05, ax = ax2, cmap=cmap, center=200)
ax2.set_title('center=3000')
ax2.set_xlabel('region')
ax2.set_ylabel('kind')
#robust的用法(颜色)f, (ax1,ax2) = plt.subplots(figsize = (6,4),nrows=2)

cmap = sns.cubehelix_palette(start = 1.5, rot = 3, gamma=0.8, as_cmap = True)

sns.heatmap(pt, linewidths = 0.05, ax = ax1, cmap=cmap, center=None, robust=False )
ax1.set_title('robust=False')
ax1.set_xlabel('')
ax1.set_xticklabels([]) #设置x轴图例为空值ax1.set_ylabel('kind')

sns.heatmap(pt, linewidths = 0.05, ax = ax2, cmap=cmap, center=None, robust=True )
ax2.set_title('robust=True')
ax2.set_xlabel('region')
ax2.set_ylabel('kind')
#annot(矩阵上数字),annot_kws(矩阵上数字的大小颜色字体)matplotlib包text类下的字体设置import numpy as np
np.random.seed(20180316)
x = np.random.randn(4, 4)

f, (ax1, ax2) = plt.subplots(figsize=(6,6),nrows=2)

sns.heatmap(x, annot=True, ax=ax1)

sns.heatmap(x, annot=True, ax=ax2, annot_kws={'size':9,'weight':'bold', 'color':'blue'})# Keyword arguments for ax.text when annot is True.  http://stackoverflow.com/questions/35024475/seaborn-heatmap-key-words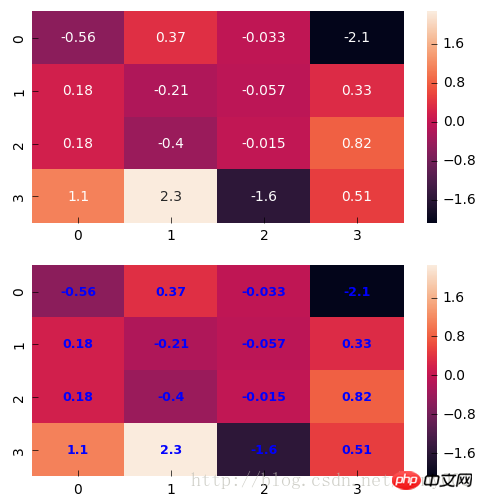
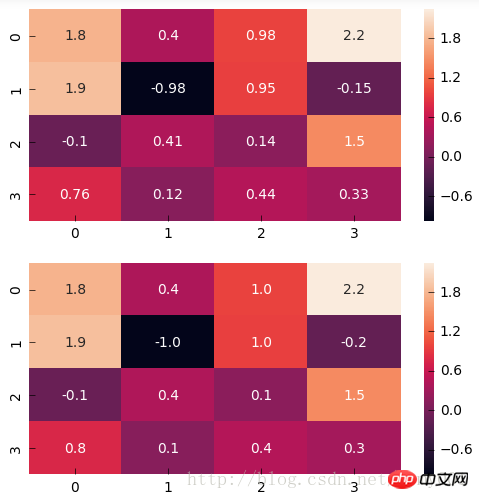
#fmt(字符串格式代码,矩阵上标识数字的数据格式,比如保留小数点后几位数字)import numpy as np
np.random.seed(0)
x = np.random.randn(4,4)

f, (ax1, ax2) = plt.subplots(figsize=(6,6),nrows=2)

sns.heatmap(x, annot=True, ax=ax1)

sns.heatmap(x, annot=True, fmt='.1f', ax=ax2)
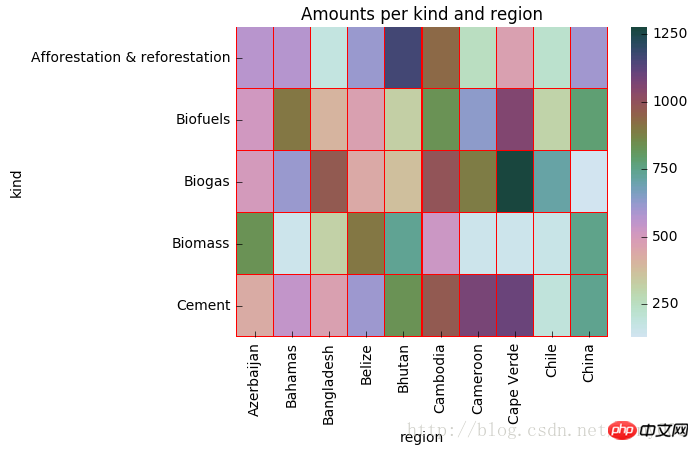
#linewidths(矩阵小块的间隔),linecolor(切分热力图矩阵小块的线的颜色)import matplotlib.pyplot as plt
f, ax = plt.subplots(figsize = (6,4))
cmap = sns.cubehelix_palette(start = 1, rot = 3, gamma=0.8, as_cmap = True)
sns.heatmap(pt, cmap = cmap, linewidths = 0.05, linecolor= 'red', ax = ax)
ax.set_title('Amounts per kind and region')
ax.set_xlabel('region')
ax.set_ylabel('kind')
#xticklabels,yticklabels横轴和纵轴的标签名输出import matplotlib.pyplot as plt
f, (ax1,ax2) = plt.subplots(figsize = (5,5),nrows=2)

cmap = sns.cubehelix_palette(start = 1.5, rot = 3, gamma=0.8, as_cmap = True)

p1 = sns.heatmap(pt, ax=ax1, cmap=cmap, center=None, xticklabels=False)
ax1.set_title('xticklabels=None',fontsize=8)

p2 = sns.heatmap(pt, ax=ax2, cmap=cmap, center=None, xticklabels=2, yticklabels=list(range(5)))
ax2.set_title('xticklabels=2, yticklabels is a list',fontsize=8)
ax2.set_xlabel('region')
#mask对某些矩阵块的显示进行覆盖 f, (ax1,ax2) = plt.subplots(figsize = (5,5),nrows=2) cmap = sns.cubehelix_palette(start = 1.5, rot = 3, gamma=0.8, as_cmap = True) p1 = sns.heatmap(pt, ax=ax1, cmap=cmap, xticklabels=False, mask=None) ax1.set_title('mask=None') ax1.set_ylabel('kind') p2 = sns.heatmap(pt, ax=ax2, cmap=cmap, xticklabels=True, mask=(pt<800)) #mask对pt进行布尔型转化,结果为True的位置用白色覆盖 ax2.set_title('mask: boolean DataFrame') ax2.set_xlabel('region') ax2.set_ylabel('kind')
f,(ax1,ax2) = plt.subplots(figsize=(4,6),nrows=2)
x = np.array([[1,2,3],[2,0,1],[-1,-2,0]])
sns.heatmap(x, annot=True, ax=ax1)
sns.heatmap(x, mask=x < 1, ax=ax2, annot=True, annot_kws={"weight": "bold"})   #把小于1的区域覆盖掉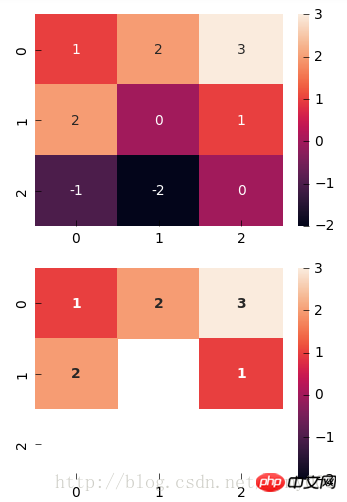
以上就是python如何实现可视化热力图的详细内容,更多请关注php中文网其它相关文章!


Copyright 2014-2024 https://www.php.cn/ All Rights Reserved | php.cn | 湘ICP备2023035733号


 0
0 99
99


![ThinkPHP5实战之[教学管理系统]](https://img.php.cn/upload/course/000/000/068/6253d87459486427.png)