这次给大家带来在Vue中使用vue2-highcharts的图文详解,在Vue中使用vue2-highcharts的注意事项有哪些,下面就是实战案例,一起来看一下。
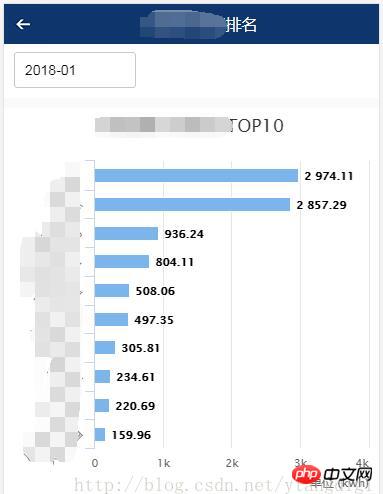
1、要实现的效果如下图:
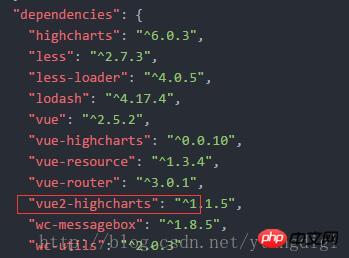
2、首先项目中引用vue2-highcharts
package.json中如下:
在命令行中输入:
cnpm install vue2-highcharts
3、页面代码如下:
<template>
<p>
</p>
<p>
</p>
<p>
<img alt="在Vue中使用vue2-highcharts的图文详解" >
<span>用能排名</span>
</p>
<p>
</p>
<p>
<datepicker></datepicker>
</p>
<p>
</p>
<p>
</p>
<p>
<vue-highcharts></vue-highcharts>
</p>
<p>
</p>
<p>
<vue-highcharts></vue-highcharts>
</p>
</template><script>
import datepicker from '../components/datepicker.vue'
import VueHighcharts from 'vue2-highcharts'
export default {
data() {
return{
topHeight:240,
freezeMon:'',
ownerFreeData: [],
options:{
credits: {
enabled: false
},
legend: {
enabled: false
},
global: {
useUTC: false
},
chart: {
type: 'bar'
},
title: {
text: ' '
},
subtitle: {
text: ''
},
xAxis:[{
categories: ['1', '2', '3', '4', '5','6', '7', '8', '9', '10'],
title: {
text: null
},
labels: {
rotation: -45
}
}],
yAxis:[{
min: 0,
labels:{
overflow: 'justify'
},
title: {
text: '单位 (kwh)',
align: 'high'
}
}],
tooltip: {
formatter: function(){
return this.x+':'+this.y+'kwh';
}
},
credits: {
enabled: false
},
plotOptions: {
bar: {
dataLabels: {
enabled: true
}
},
series: [{
type: 'bar'
}]
}
}
}
},
methods: {
picked(year, month, date) {
if(month < 10){
this.freezeMon = `${year}-0${month}`;
}else{
this.freezeMon = `${year}-${month}`;
}
this.getList();
},
routerBack(){
this.$router.go(-1);
},
getList(){
let maxLineCharts = this.$refs.maxLineCharts;
let minLineCharts = this.$refs.minLineCharts;
if(maxLineCharts != null && minLineCharts != null){
//移除所有Series
maxLineCharts.removeSeries();
minLineCharts.removeSeries();
//设置标题名
maxLineCharts.getChart().title.update({ text: '用能最大TOP10' });
minLineCharts.getChart().title.update({ text: '用能最小TOP10' });
var userType = sessionStorage.getItem('userType');
var areaCode = sessionStorage.getItem('areaCode');
this.$http.post(this.URLINFO + '/mobile/rankingMonitor/getDayFreezeApp.do',{yearMonth:this.freezeMon,userType:userType,areaCode:areaCode})
.then(function (res) {
var seriesData = []
var categoriesData = []
for(var i = 0;i < res.data.max.length; i++) {
//maxLineCharts.addSeries({name:res.data.max[i][1],data: [{name: res.data.max[i][1],y:res.data.max[i][2]}]});
seriesData.push([res.data.max[i][1],res.data.max[i][2]]);
categoriesData.push(res.data.max[i][1]);
}
maxLineCharts.addSeries({name: '用能',data: seriesData});
maxLineCharts.getChart().xAxis[0].setCategories(categoriesData);
seriesData = []
categoriesData = []
for(var i = 0;i < res.data.min.length; i++) {
//minLineCharts.addSeries({name:res.data.min[i][1],data: [{name: res.data.min[i][1],y:res.data.min[i][2]}]});
seriesData.push([res.data.min[i][1],res.data.min[i][2]]);
categoriesData.push(res.data.min[i][1]);
}
minLineCharts.addSeries({name: '用能',data: seriesData});
minLineCharts.getChart().xAxis[0].setCategories(categoriesData);
})
.catch(function (error) {
this.$toast('查询排名信息异常');
});
}
}
},
components: {
datepicker,
VueHighcharts
},
mounted () {
this.getList()
}
}
</script><style>
*{margin:0;padding:0; list-style:none }
h1,h2,h3,h4,h5,h6{font-size:16px; font-weight:normal;}
.rank-head{
width: 100%;
height: 40px;
position:fixed;
background: -webkit-linear-gradient(top,rgba(0,0,0,.6),rgba(0,0,0,0));
z-index: 999;
color: #fff;
font-size: 16px;
text-align: center;
line-height: 40px;
}
.container{
width: 100%;
overflow: hidden
}
.rank-head-back{
display: block;
float: left;
width: 40px;
height: 40px;
background: url("../assets/index/back.png") no-repeat center center;
background-size: 100% 100%;
}
</style>相信看了本文案例你已经掌握了方法,更多精彩请关注php中文网其它相关文章!
推荐阅读:
AngularJS中@HostBinding()和@HostListener()有什么区别
以上就是在Vue中使用vue2-highcharts的图文详解的详细内容,更多请关注php中文网其它相关文章!


Copyright 2014-2024 https://www.php.cn/ All Rights Reserved | php.cn | 湘ICP备2023035733号


 0
0 19
19


![ThinkPHP5实战之[教学管理系统]](https://img.php.cn/upload/course/000/000/068/6253d87459486427.png)